Learn how to future-proof your test automation pipeline with Cypress and Applitools by adding tests that run from GitHub Actions. In this article, we’ll share how to ensure your test automation pipeline can scale while staying reliable and easy to maintain.
Automating different types of tests
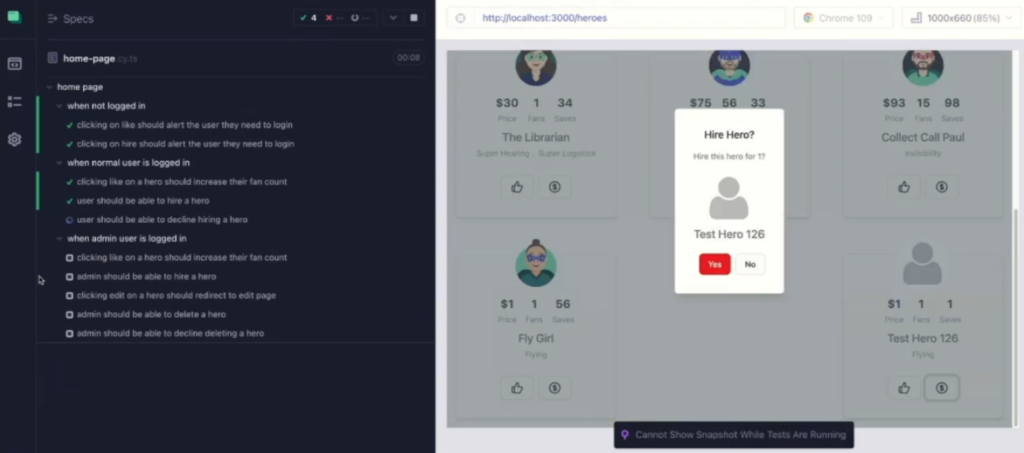
To illustrate our different types of test automation, we’ll be using the example project Cypress Heroes. In this full-stack TypeScript app, users can take the following actions:
- Log in with an email and password
- Like heroes, which increments the hero’s number of fans
- Hire heroes, which increments the hero’s number of saves
- Manage hero profile information like name, superpowers, and price

ICYMI: Watch the on-demand recording of Future-Proofing Your Automation Pipeline to see Ely Lucas from Cypress demo the example project.
End-to-end testing
Cypress is traditionally known for end-to-end testing. You automate user interactions for specific scenarios from start to finish in the browser, and then run functional assertions to check the state of elements at each step. End-to-end tests are hidden in an actual web server and hit the site just like a user would.
Measurable stats for code coverage of your end-to-end testing can act as a health metric for your website or app. Adding coverage reports to your automation pipeline as commits can help ensure you’re testing all parts of your code.
Component testing
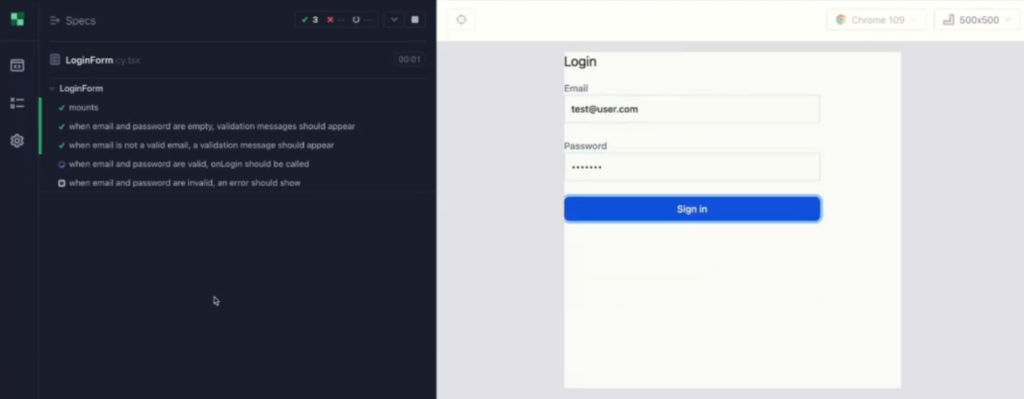
If you’re using a component-based framework like React or Angular or a design system like Storybook, you can also do component testing to test UI components. In this example, we have a button component with a few tests that pass, the hero card test, and a test for the login form. These components are being mounted in isolation outside of your typical web server.

Think of component tests as “UI unit” tests. While they don’t give end-to-end coverage, they’re quick and easy to run.
API testing
For your back end, you’ll need to automate API tests. The example project is using a community-built plugin called cypress-plugin-api. This plugin provides an interface inside the Cypress app to test APIs. It’s really cool and it’s super fun, and it allows you to write tests that you would have to do manually in a tool like Postman.
Fun fact: Cypress Ambassador Filip Hric developed the cypress-plugin-api. Check out Filip’s Test Automation University courses.
The API tests in our example are in the separate server project. We can use the command npx cypress open, and then we can run those tests in Chrome. We can see all of our results that we’re getting the response of the status codes. We can view a post request, the headers that were sent, the headers that were returned, and other stuff that you normally get from a tool like Postman.
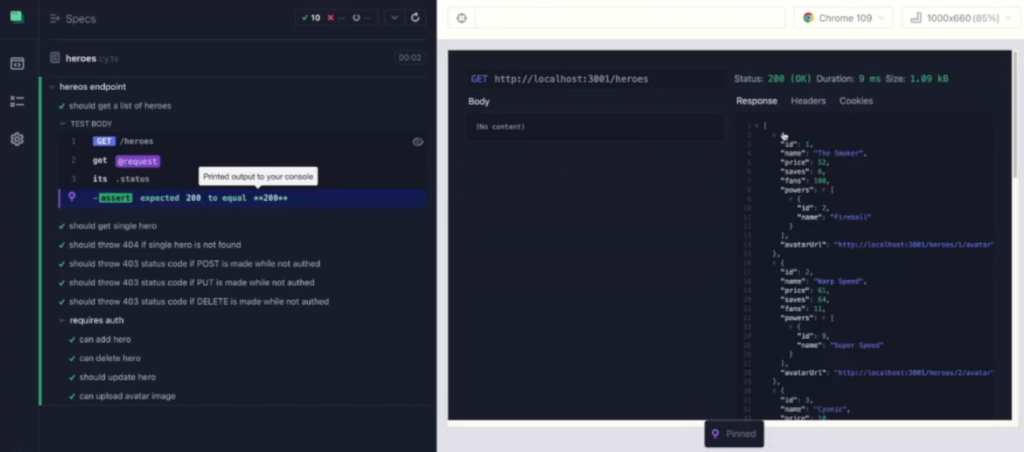
And it’s just baked into the app, which is really nice. Cypress is basically a web app that tests a web app. And so, you could extend Cypress as an app with things like this to help you do your testing and to have it all seamlessly integrated.
Running a pipeline with GitHub Actions
The example project uses GitHub Actions to set up the test automation pipeline. When working on smaller projects, it’s easy to have CI interactions baked into your repository, all in one place.
Configuring your GitHub Action
With GitHub Actions, you declare everything you need in a YAML file in the .github/workflows folder. Your actions become part of your repository and are covered by version control. If you make any changes, you can review them easily with a simple line-by-line diff. GitHub Actions make it easy to automate processes alongside other interactions you make with your repository. For example, if you open a pull request, you can have it automatically kick off your tests and do linting. You can even perform static code analysis before merging changes.
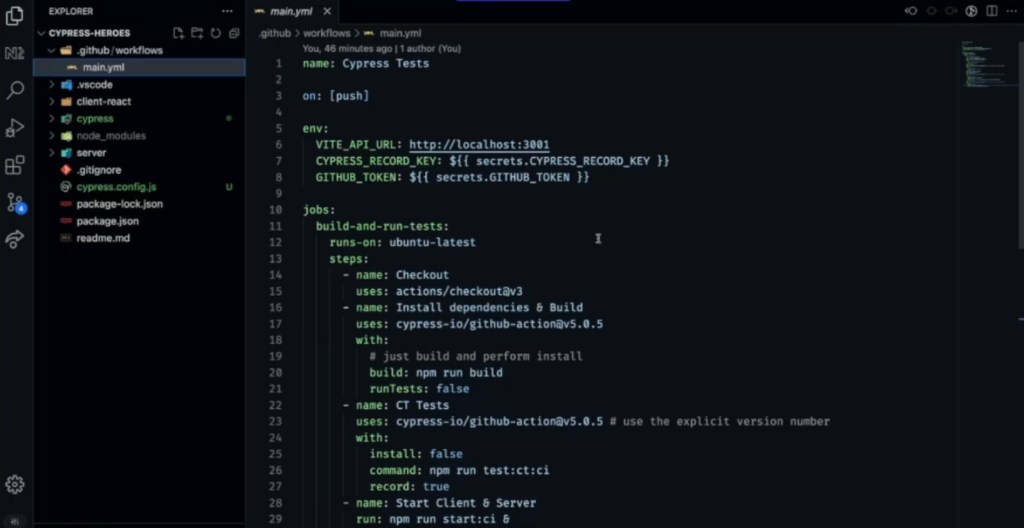
Some environment variables are set at the top of the YAML file. The API URL is what the client app uses to communicate to the API. The example app is hooked up to send test results to the Cypress Cloud. Those results can then be used for analytics, diagnostics, reporting, and optimizing our test workflows. The Cypress cloud also requires a GitHub token, so it can do things like correctly identify what pull request is being merged.
For those new to GitHub Actions: You can define environment variables per step in a job, but declaring them at the top helps you update them painlessly.
Running each of our tests
To keep things simple, there is only one job right now in this GitHub Action. First, it checks out the code straight from GitHub. Next, it builds the project using the Cypress GitHub Action. The Cypress GitHub Action does a few things for you like building your application or npm installing or yarn installing the dependencies.
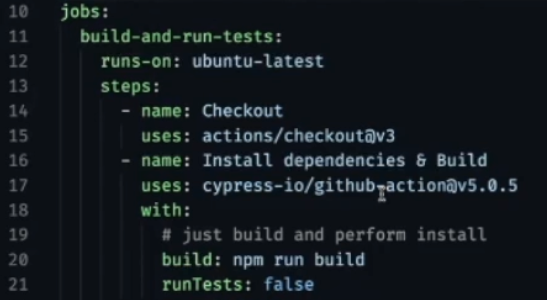
Building first means that subsequent jobs don’t have to build the app again. We’ve set run test to false, which is a parameter to the Cypress GitHub Action, because we don’t want to run the tests here. We’ll be running the tests separately below.
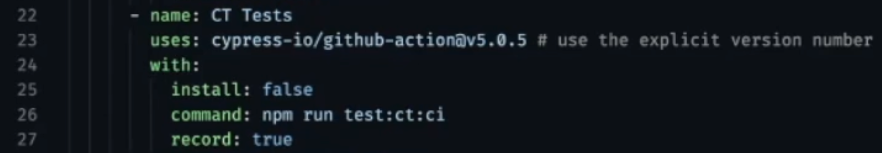
We have our component tests in our GitHub Action. We tell it to install false, since we installed it up above. And then we run our custom test command, which opens Cypress in run mode and initiates component testing. This record tells the GitHub Action to send the results to Cypress Cloud.
And then we have to start the client and server. For both end-to-end tests and API tests, the application must be up and running component tests. For the end-to-end test and API tests, the example app is hitting live servers.

This run command will start both the React app and the Node server, and then it will run the end-to-end test. We’re telling it again to not install the dependency, since it was already installed. Then, we’re running the command to start the end-to-end testing. The wait command will wait to make sure that both the client URL and the API URL are both up and running before it will start the test. If the test starts before both URLs get up and running, you’ll have some tests fail.
Another thing that the Cypress GitHub Action does is that you have the option to wait for these services to be live before the testing starts. By default, the npm run test commands are going to use the Chromium browser built into Electron. If you want to test on other browsers, you must make sure those browsers are installed on the runner. Cypress provides Docker images that you can add to your configuration to download the different browsers. However, downloading additional browsers increases the file size and makes the runs take longer.
Make sure that the Cypress binary itself is downloaded and installed. It’s going to run headlessly. This is because the command set up in these scripts is run mode, which is headless, whereas open mode is with the UI.
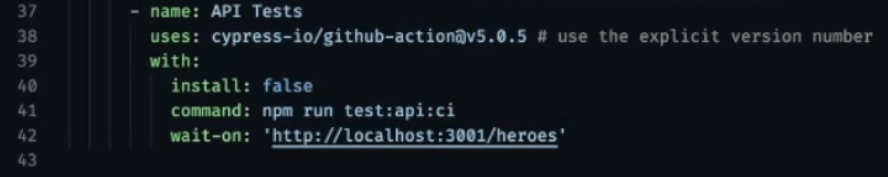
And then it will run the API test, which is very similar to end-to-end tests, except that since we’re not hitting the actual client app – only hitting the API app – we’re only waiting to make sure that the API URL is up and running.
If you write test cases per the local database for end-to-end testing before pushing to GitHub Actions, someone else running those test cases on their system could potentially fail. In whatever kind of test automation you develop, you’ll need to handle test data properly to avoid collisions. There are many different strategies you can follow. For more information on this and solving sample data dependency, watch my talk Managing the Test Data Nightmare.
How long do the test suites take?
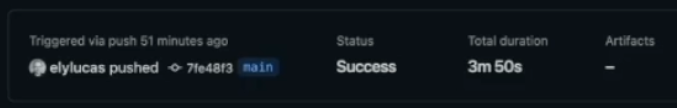
When running your tests with Cypress and GitHub Actions, the results are uploaded to Cypress Cloud. You can go into Cypress Cloud and actually watch replays of all these tests that happened. The entire pipeline run in the example was 3 minutes and 50 seconds for all three test suites.
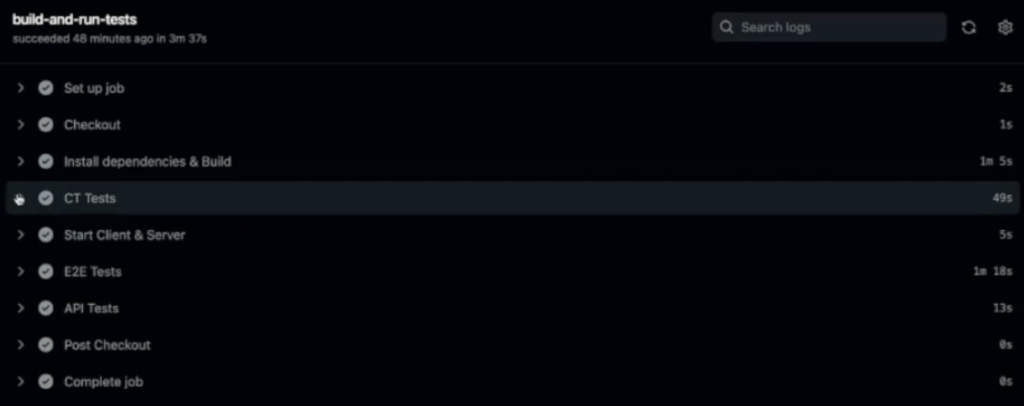
The individual test suites we ran took the following times:
- Component tests: 49 seconds
- End-to-end tests: 1 minute and 18 seconds
- API tests: 13 seconds
Improving test coverage with visual assertions
Since all the Cypress tests are run inside of the browser window, you can visually see them and inspect to make sure that they’re looking correctly. But this type of review is a manual step. If someone accidentally makes a change to the stylesheet, the site could no longer be running properly, but if we run the tests, they’ll pass.
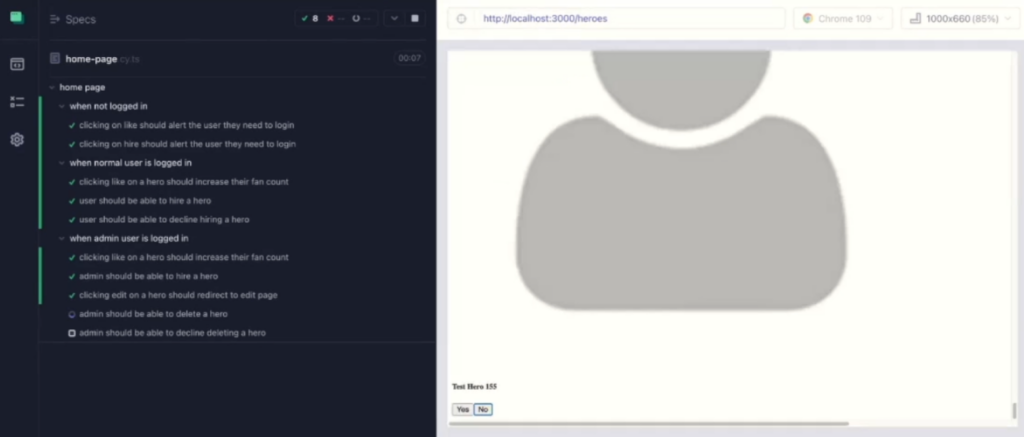
We can use Applitools Eyes to fix this issue.
Visual testing is meant to automate the things that traditional automation is not so good at. For example, as long as particular IDs on your page are in the DOM somewhere, your traditional automation scripts with something like Cypress are still going to find and interact with the elements. Applitools Eyes uses visual AI to look at an app and be able to detect these kinds of visual differences that traditional assertions struggle to capture. Let’s add some visual snapshots to these end-to-end tests.
Adding Applitools to your project
First, you’ll need an Applitools account. You can register a free Applitools account with your GitHub username or your email, and you’ll be good to go. You’ll need your Applitools API key for when we run tests with Applitools.
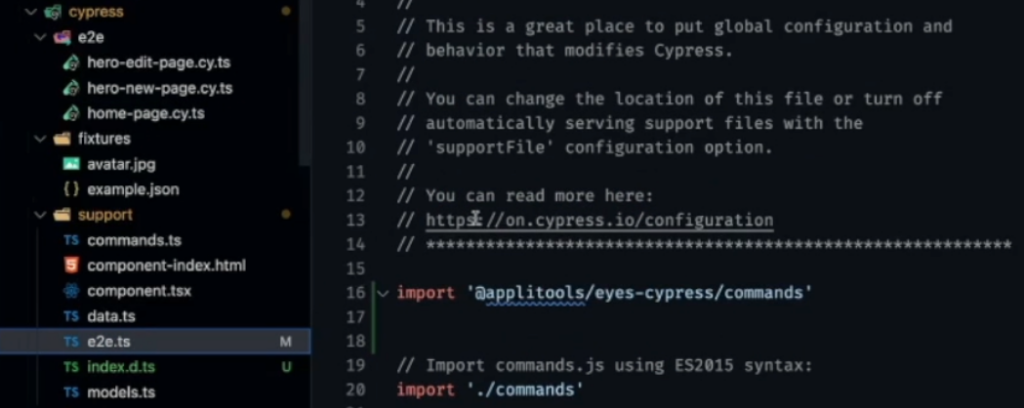
Next, we’ll need to install the Applitools SDK using npm install @applitools/eyes-cypress.
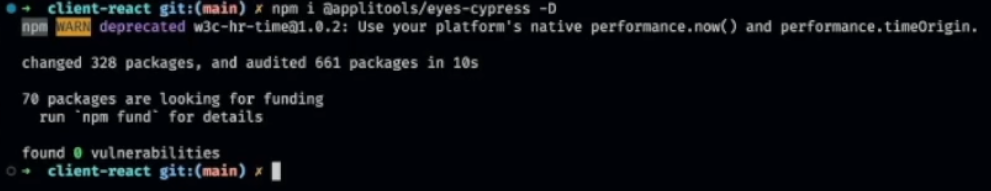
It can be a dev dependency or it can be a regular dependency – whichever you prefer. In the example project, we use a dev dependency. In the example project, we’re using the Applitools Eyes SDK for Cypress, we have Applitools SDKs for basically every tool framework you got.
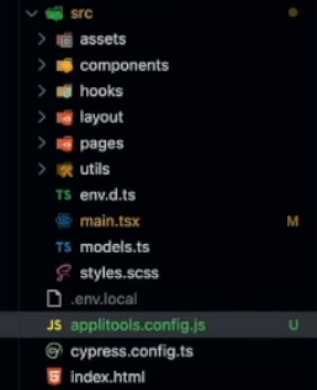
Next, we’ll need to create an Applitools configuration file. Where in Cypress projects, you have your cypress.config.js file, basically we want one that’s called applitools.config.js.
Configuring your Applitools runner
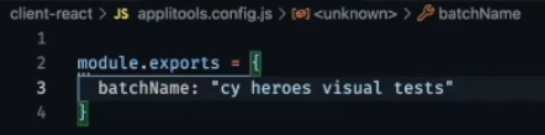
In the Applitools config file, we will specify the configuration for running visual tests. There’s a separation between declaring configuration and actually adding test steps.
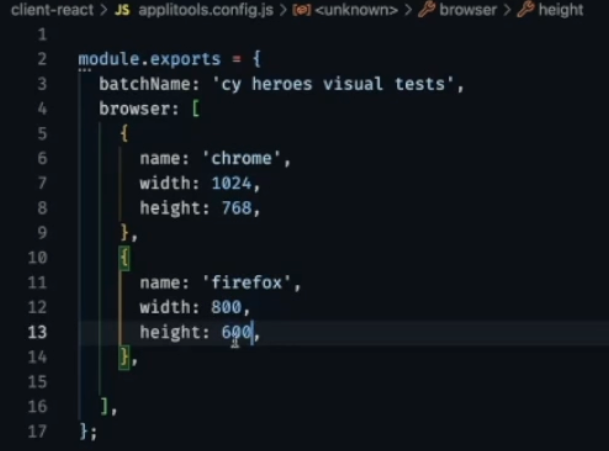
One of the settings we want is called batchName, and we’re going to set that to “cy heroes visual tests” to reflect the name of our demo app. The batch name will appear in the Eyes Test Manager (or the Applitools “dashboard”) after we run our visual tests.
Next, we’ll set the browsers. This will be a list, with each item being an entry that specifies a browser configuration, including name, width, and height.
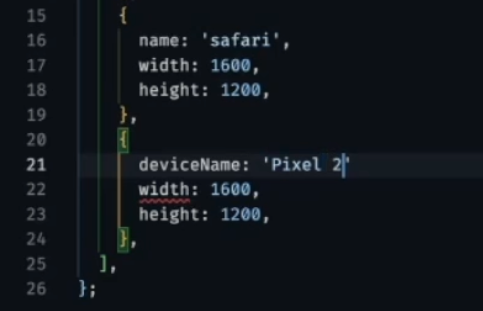
Typically, since Cypress runs inside of an Electron app, it can be challenging to test mobile browsers. However, the Applitools Ultrafast Grid enables us to render our visual snapshots on mobile devices. The settings for mobile devices are going to be a bit different than those for browsers. Instead of having a name, we’re going to have a device name.
Our applitools.config.js file is complete. When we run our tests – either locally or in the GitHub Action – Applitools will render the snapshots it captures on these four browser configurations in the Ultrafast Grid and report results using the batch name. Furthermore, the local platform doesn’t matter. Even if you run this test on Windows, the Ultrafast Grid can still render snapshots on Safari and mobile emulators. A snapshot is just going to be a capture of that full page. Applitools will do the re-rendering with the appropriate size, the appropriate browser configuration, and all that will happen in the cloud. Essentially you can do multi-browser and multi-platform testing with simple declarations.
Now that we have completed the configuration, let’s update the tests to capture visual snapshots, starting with the homepage.
Setting up our test suites
You need to make sure that your tests aren’t interfering with other tests. In these tests, we’re going through and modifying some of the heroes that are in the application. The state of the application changes per test, so to get around that, we’re creating a new hero just for working with our tests and deleting the hero after the tests.
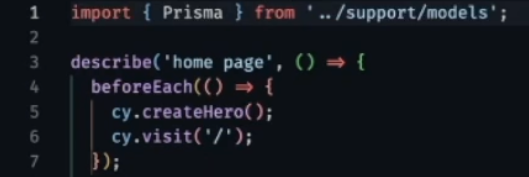
In the example, we’re using Cypress tasks, which is code that actually runs on the Node process part of Cypress. It’s directly communicating with our database to add the hero, delete the hero, and all the other types of setup tasks that we want to do before we actually run our test.
So it’s going to happen for each of the tests, and then we’re visiting the homepage and getting access to the hero.
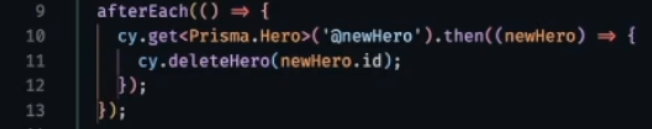
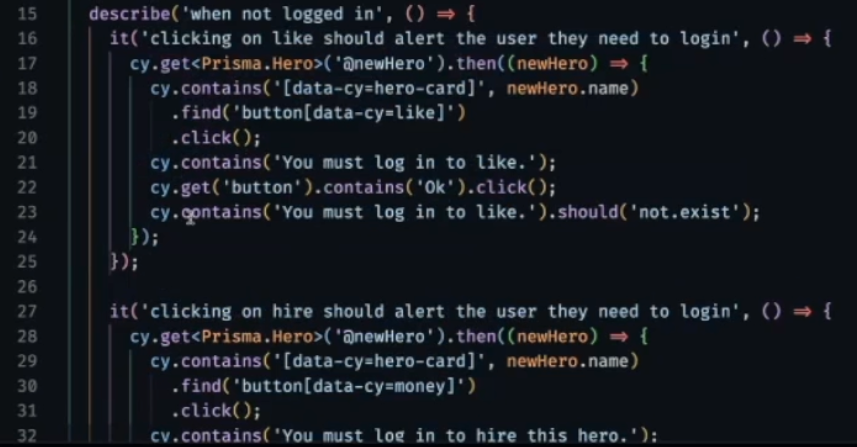
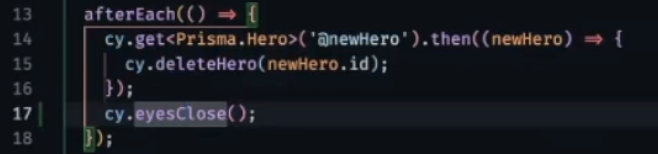
We get our new hero and then we call cy.deleteHero, which is going to call the database to delete the hero. From the describe block at the start of every test, we get our hero. And then, finally, we have the hero card by its name, and we find the button that has the right selectors, so we can actually select it and click the button.
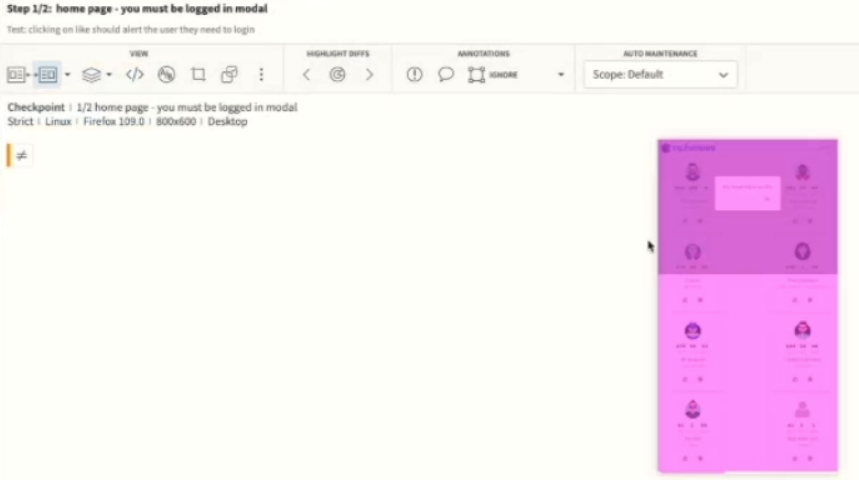
This test is making sure that you’re logged in before you can like this hero. We’re making sure that the modal popped up, clicking the okay on the modal, and then making sure that modal disappears and does not exist anymore.
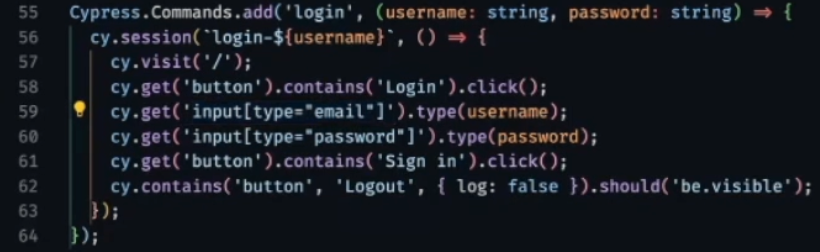
Down below we have another suite for when a normal user is logged in. And so we’re using a custom Cypress command to log in with this username and password. You can define these custom commands that are like making your own function, encapsulating a little bit of logic so that it could be reusable.
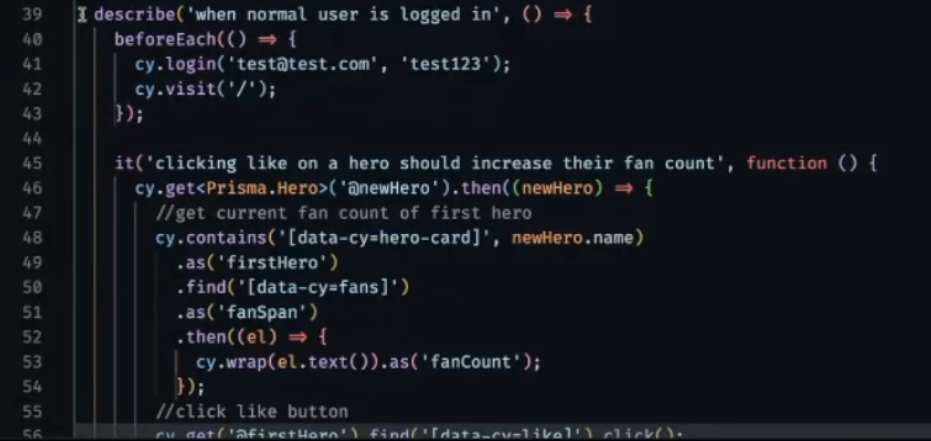
So what we’re doing to test the login is going to the homepage, running the login process, and verifying the login was actually successful. The cy.session is caching a session for us to restore the session later from cookies. This helps speed up your test so you’re not having to go through the whole flow of actually logging in again.
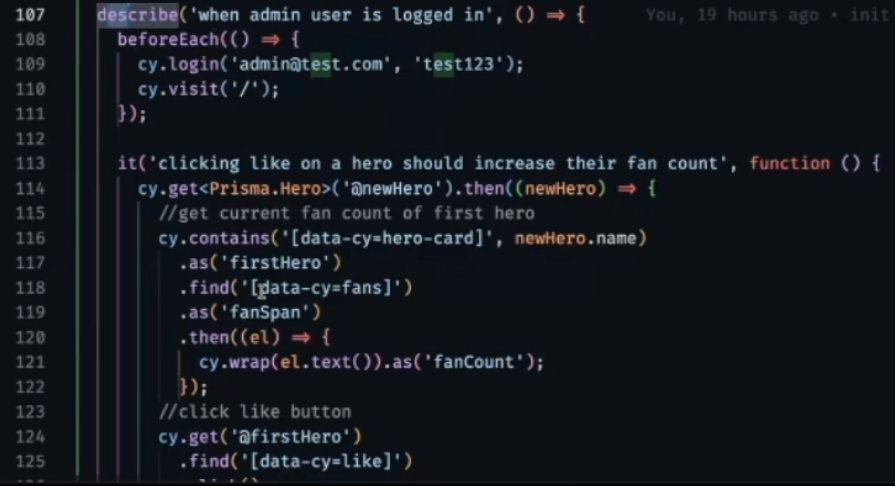
We have another suite here for when an admin user is logged in, because an admin user can edit users and delete heroes.
In the example, negative login tests – where you use the wrong username and/or password – are under the component tests.
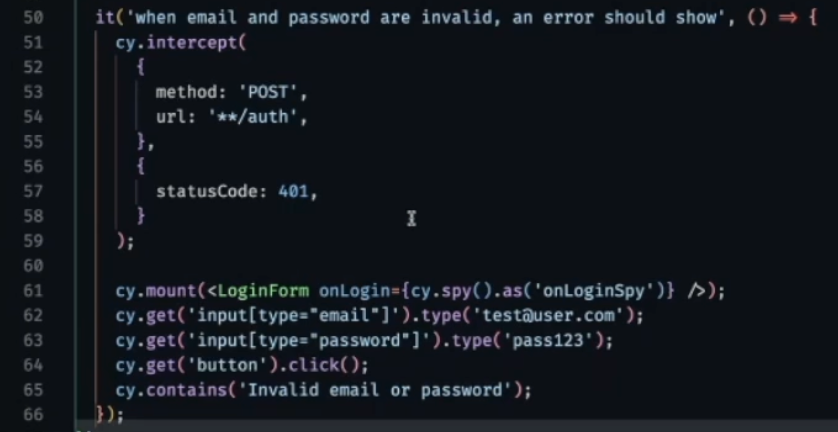
In the login form component test, when an email and password is invalid, an error should show. The example uses cy.intercept to mock the API request that goes to the cert, which goes to the off endpoint and returns a status code 401, which represents an invalid login.
You can either write a component test or an end-to-end test. In this case, a component test makes it easier to set up the mock data.
Adding a call to Applitools Eyes
With the test suites set up, we’re ready to add some visual snapshots here. We need to call an Eyes session using the Applitools Eyes SDK. The idea is that we open our eyes, and we can take visual snapshots. And then at the end of the test, we will close our eyes to say that we’ve captured all the snapshots for that session or for that test. And at that point, Applitools Eyes will upload the snapshots that are captured to the Applitools Eyes server, do all of the re-rendering of the things of those four browsers in the Ultrafast Grid. Then we can log into the Applitools dashboard and we can see exactly what happened with our testing.
To get the autocomplete for Eyes commands, we need to set up the Applitools Eyes stuff with the Cypress project. We already did npm install on the package, so we’ll need to run npx eyes-setup.
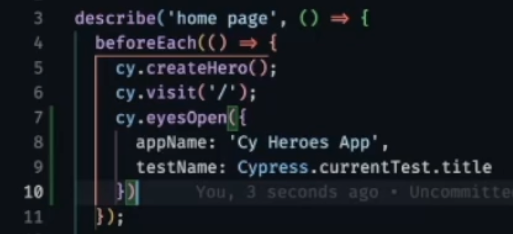
We’ll want to use the command cy.eyesOpen in the homepage describe block under the beforeEach method. We want to pass an app name and test name for logging and reporting purposes. You might also put their Cypress eyes open code in the beforeEach of the test cases, so the call doesn’t need to be duplicated.
Then, in the afterEach block, you’ll call cy.eyesClose.
In this test, you must log in, make sure that the modal pops up, log in, and then click okay in the modal and make sure the modal disappears, so we’ll need a snapshot when the modal is up and one when the modal goes away. In this case, we’ll capture the whole window.

If we didn’t want to capture everything, we could actually capture a region, like a div or even an individual element. On a small scale, using the region option does not make a measurable difference in execution speed, but it gives you a way to tune the type of snapshot we want.
For capturing the next step, we can basically copy the whole call there and paste it, changing the tag to homepage with the modal dismissed.

These snapshots are very straightforward to write, and something that we could consider is that some of those other assertions you might arguably be able to remove. The visual snapshot is going to capture everything on that window, so if it’s there and visible, we’re going to capture it and track it over time.
You would still need to keep all of your interactions, but you can remove most of your assertions checking visible elements. However, there are certainly things where if you want to check a very specific numeric value, you still want to keep those assertions.
Running the updated tests
All we need to do to run this test is make sure that we have our Applitools API key from our account saved as an environment variable of the Cypress application.
Note: If you happen to steal someone’s API key, it doesn’t really help you. It just means they’ll see your results, and you won’t. API keys should be kept secret and safe.
Using the Applitools Eyes dashboard
So to see the visual testing results, we will need to view them in the Applitools Eyes dashboard.
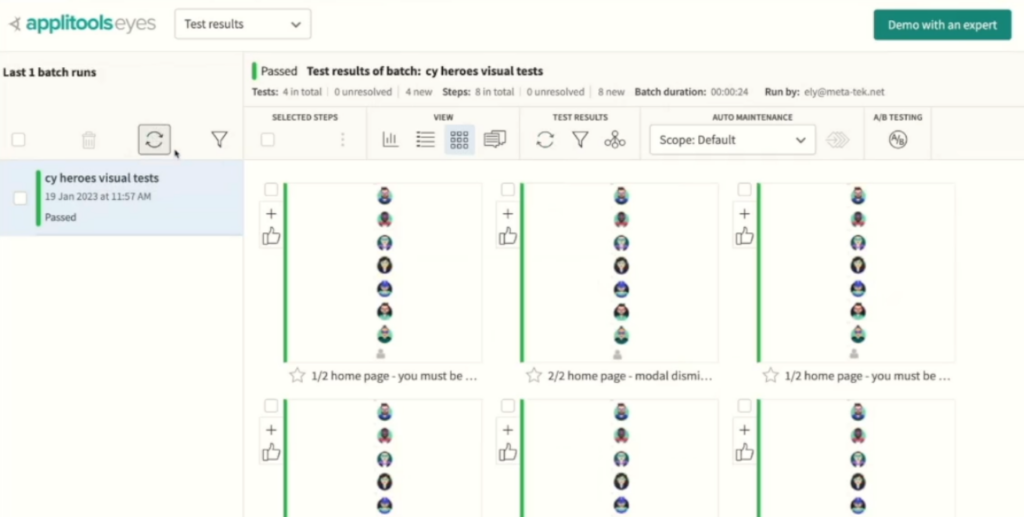
You can view your test results in a grid to see the UI quickly, or you can view your results in a list to see your configurations quickly.
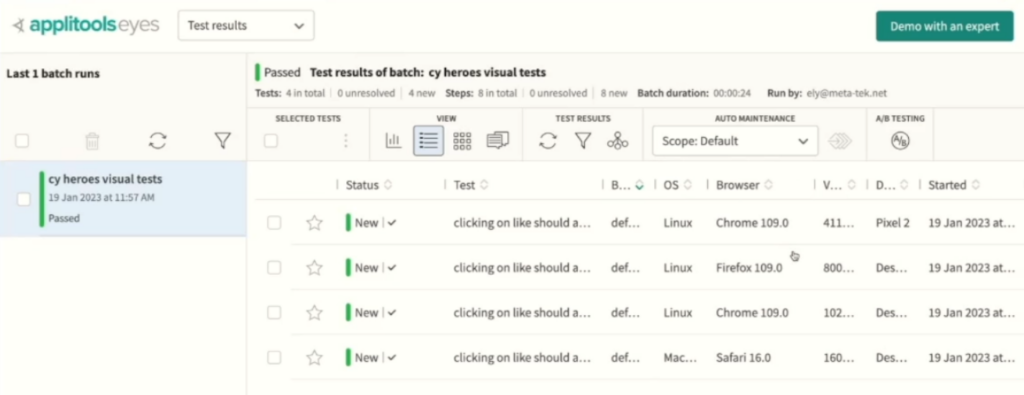
On the left, you’ve got the batch name that was set. Then on the main part of the body, you’ll see there are actually four tests. We only wrote one test, but each test is run once per browser configuration we specified, providing cross-browser and cross-platform testing without additional steps.
If we open up the snapshots, you can see the two snapshots that we captured. These results are new, because this is the first time we’ve run the test.
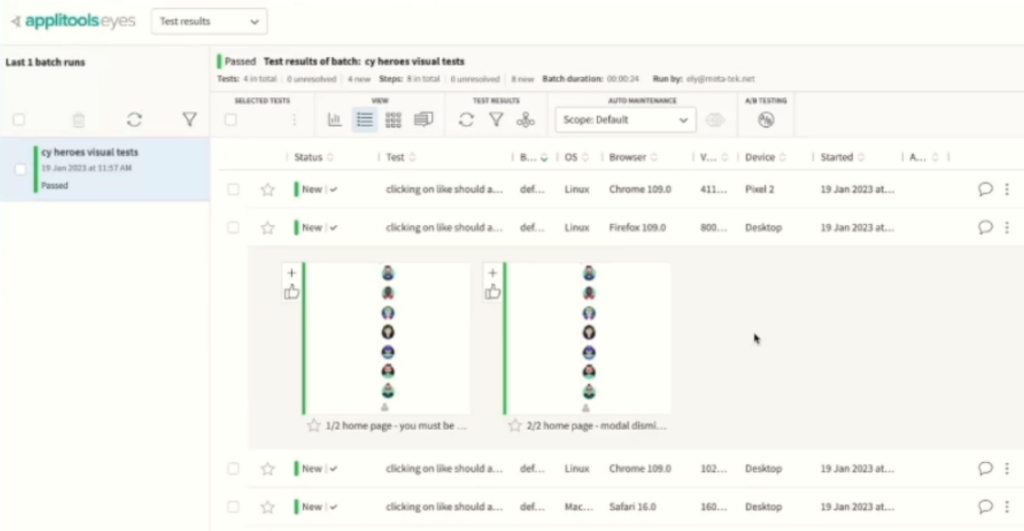
We’ve established the snapshot as a baseline image, meaning anything in the future will be checked against that.
That’s where that visual aspect of the testing comes in. Your Cypress results will essentially tell you if it was bare bones basic functional, and then Eyes will tell you what it actually looked like. You get richer results together.
Resolving test results in the dashboard
Let’s see what this looks like if we make that visual change.
In the main file, we’ve updated the stylesheet and run the test again. There is no need to do anything in the Applitools Eyes dashboard before re-running the test.
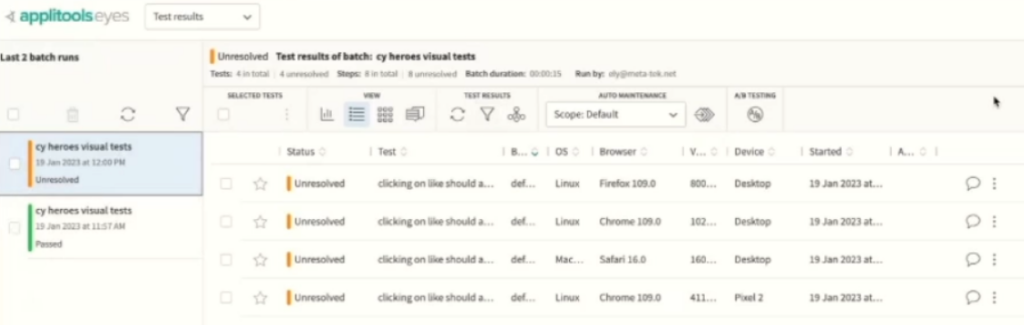
The new test batch is in an unresolved state because Eyes detected a visual difference. In theory, a visual difference could be good or bad. You could be making an intentional change. Visual AI is basically a change detector that makes it obvious to you, the human, to decide what is good or bad. Then anytime Applitools Eyes sees the same kind of passing or failing behavior in the future, it’ll remember.
It’s important to note that the unresolved test results won’t stop your test automation job or your automation flow. Test automation would complete normally. You as the human tester would review visual test results in the Eyes Test Manager (the “dashboard”) afterwards. The pipeline would not wait for you to manually mark visual test results.
Let’s open up one of those snapshots so we can see it full screen.
In the upper left, below the View menu in the ribbon, there’s a dropdown to show both so that you can see the baseline and test side by side.

In the example, we had removed the stylesheet, so we can see very clearly that it’s very different. It’s not always this obvious. In this case, pretty much the whole screen is different. But if it were like a single button that was missing or something shunted a little bit, it would show that a specific area was different. That’s the power of the visual AI check.
Whenever Applitools detects a visual change, you can mark it as “passing” with a thumbs-up. Then that snapshot automatically becomes the new baseline against which future checkpoints are compared. Applitools will go to the background and track similar images. And it will automatically update those appropriately as well.
Note: If you ever want to “reset” snapshots, you can also delete the baselines and run your tests “fresh” as if for the first time. The snapshots they capture will automatically become new baseline images.
Once we’ve resolved all test results, we’ll need to save. And now if we were to rerun our test again, Applitools Eyes would see the new snapshots and pass tests as appropriate. If you have dynamic content or test data, you add region annotations, which will ignore anything in the region box.
It is possible to compare your production and staging environments. You can use our GitHub Integration to manage different branches or versions of your application. We also support different baselines for A/B testing.
Closing thoughts
That’s basically how you would do visual testing with Applitools and Cypress. There are two big points to remember if you want to add visual testing to your own test suites:
- To get these tests running in your pipeline, the only change you’d have to make is to inject the Applitools API key in those environment variables.
- We didn’t really add a fourth suite of tests. Visual testing is more of a technique or an aspect of testing, not necessarily its own category of tests. All you have to do is work in the SDK, capture some snapshots, and you’re good to roll.
We hope this guide has helped you to build out your test automation pipeline to be more reliable and scalable. If you liked the guide, check out our Applitools tutorials for other guides on building your test automation pipeline. Watch the on-demand recording of Future-Proofing Your Automation Pipeline to see the full walkthrough. To keep up-to-date with test automation, you can peruse our latest courses taught by industry-leading testing experts on Test Automation University. Happy testing!