The first tool that most engineers probably associate with front end or client side performance testing is Google Lighthouse. So when I stumbled upon a Cypress plugin which lets you run Lighthouse audits directly from your Cypress tests, I had to share this knowledge with the community.
Why test for Performance?
Because of the advancement in technology over the years, we are now accustomed to instant gratification with how information is provided to us. When we want information, we want it now and any delays in receiving this information is met by frustration. It’s also been proven by numerous studies that our attention span has decreased over time.
In the context of page performance, if we see that a page has poor speed, we are quick to go to a competitor’s website rather than wait for the website with poor speed to finish loading. This can ultimately mean loss of revenue to businesses.
Performance Testing in a Nutshell
When we talk about performance testing, it’s typically divided into two areas: client side and server side. One of the most common approaches in server side performance testing is load testing. Load testing is verifying that your servers can handle the load accordingly when multiple requests are sent from different users simultaneously. You can anticipate how your servers will respond by simulating high concurrent users using tools such as JMeter, K6, or Gatling, to name a few.
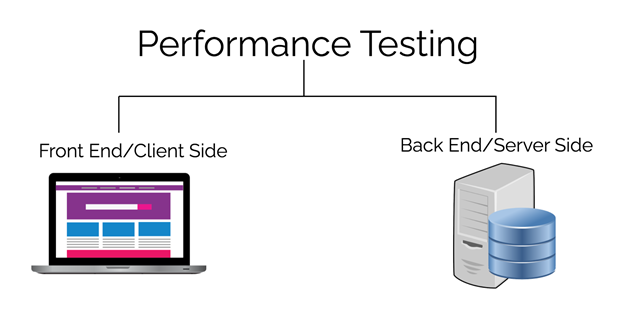
On the other hand, when we speak about client side performance testing, the aim is to test how fast a single user can see the web responses instantly. Our servers might be able to handle the concurrent load but the way different browsers process data from servers also has an impact on performance. For example, JavaScript makes websites interactive but it can also contribute to why a website is slow especially if it’s not optimized. A single user’s performance experience is as important as multiple users.
As mentioned above, one of the most popular tools out there is Lighthouse, a free and open source tool for improving the quality of your web pages.
Google Lighthouse
Lighthouse audits the performance of your website by crawling a page that you provide and running the audits against key performance metrics. Apart from performance, it also lets you audit other areas such as accessibility, best practices and search engine optimization.
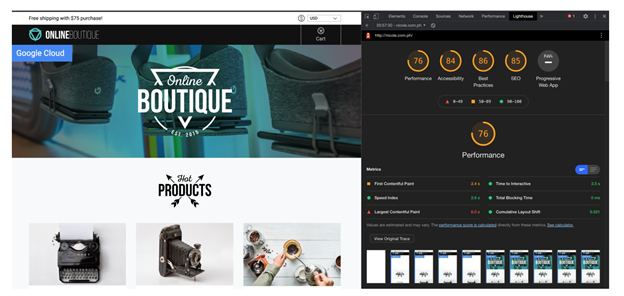
To get started with Lighthouse, you really don’t need additional technical skills. The easiest way to get started is to simply open up your Chrome browser, visit a website of your choice, open up developer tools and click the Lighthouse tab. From the Lighthouse tab, you can start the audit as seen on the image below.
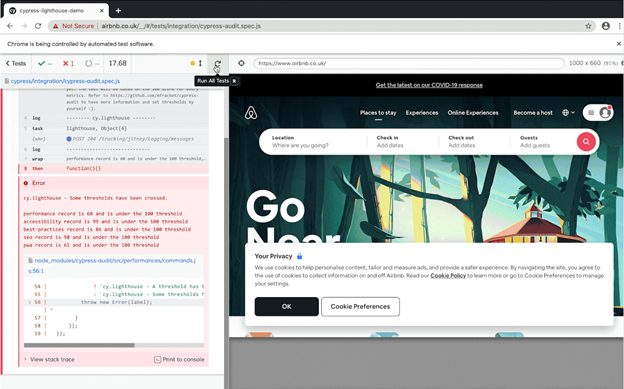
There are also other ways to run Lighthouse audits, such as using the Lighthouse browser extension, which is also available on Firefox. Lighthouse CLI lets you run the audit straight from your command line or programmatically. And cypress-audit, a Cypress plugin, lets you integrate Lighthouse scores straight from your Cypress tests.
In Lighthouse 6.0, which is currently the latest version, there are six important performance metrics which are important to understand.
- First Contentful Paint (FCP)
FCP measures how long it takes for the browser to render the first piece of DOM content after a user navigates to your page.
- Large Contentful Paint (LCP)
LCP measures how long it takes for the browser to render the largest piece of DOM content (image or text block) after a user navigates to your page.
- Speed Index
Speed index measures how long the content visually loads on page load.
- Time to Interactive (TTI)
TTI measures how long it takes for the page to become fully interactive.
- Total Blocking Time (TBT)
TBT measures the time the page is blocked from responding to user inputs. Anything that executes above 50ms is considered a blocking task.
- Cumulative Layout Shift (CLS)
CLS measures the visual stability of your page.
With the above performance metrics, the lower the scores, the better it is.
Cypress-audit configuration
Cypress-audit is a free plugin that you can use to integrate Lighthouse into your Cypress tests. Integrating cypress-audit into your code base can be done in three steps:
Install cypress-audit
The first step is to install the cypress-audit plugin. This can be done by typing the following to your terminal:
npm install --D cypress-audit-
Configure Lighthouse CLI
The second step is to prepare the Lighthouse CLI configuration. Cypress-audit uses Lighthouse CLI under the hood and if you have used Lighthouse CLI already, it opens up a Chrome browser and runs the audit. Similarly, when you run your Cypress tests, it also launches the Chrome browser by default when you use the visual test runner. Because we want to run lighthouse inside the same browser as Cypress rather than opening a new one, the following code needs to be added in your plugins/index.js.
Since Cypress reacts to various browser event before we launch the browser, we are simply going to pass the launchOptions object, which contains information on how the browser is launched, to the prepareAudit function. This way, cypress-audit will know information about our browser.
Then we create a new task called lighthouse to invoke the lighthouse process. This is needed because Lighthouse CLI is a node.js backend process so in order for us to use this within our Cypress tests, we need to wrap it as a task.
-
Inform Cypress of Lighthouse Command
The third and final step that we need to complete the cypress-audit setup is to import the
cy.lighthouse()command to our support/commands.js to make Cypress aware of this new command.import ‘cypress-audit/commands’;The complete setup can also be found on my performance testing github repository which you are free to clone.
Writing the Test
Visit any web page you want by calling cy.visit('/’). Then to actually run the audit, we need to call cy.lighthouse() afterwards.
By default, cypress-audit will run the test based on a score of 100 for every metric.
The thresholds can be modified and you are free to customise which metrics you want to track.
You can also pass in a custom configuration to update the metric scores. Here is a code snippet on how you can pass custom configurations in cypress-audit.
I highly recommend that you have a read through cypress-audit and Lighthouse CLI’s documentation to understand what other configurations can be modified. Alternatively, check out my blog post, Web Performance Testing with Google Lighthouse, for a more in-depth explanation.
Final Thoughts
Using Lighthouse within your Cypress tests is just one of the many ways out there to monitor the performance of your website. Think about your requirements carefully and then decide whether this approach is right for you and your team.