Imagine this. You built a page with CanvasJS, and you want to test the graphs. How do you create an automated test for the graphical representations? It’s testing dynamic content, after all.
This question haunts most test developers. In lots of cases, companies do lots of manual tests on the first release to make sure everything works. After that, it’s a lot of manual spot testing without automation. Because, it’s testing dynamic content, after all.
In reality, there are three approaches.
- Always do manual testing – that’s the only way to validate behavior.
- Do spot testing – trading off coverage for the cost.
- Shy away from testing and hope things work.
At the radical end of handling dynamic graphical content, some organizations decide that the job doesn’t belong to the internal web development team. These organizations farm out the entire visualization process to a third-party graphing package. For example, the Federal Trade Commission concluded that their data is best visualized using an external solution focused on data graphics and analytics. As a result, they use the services of Tableau Software to create a visual representation of the FTC data.
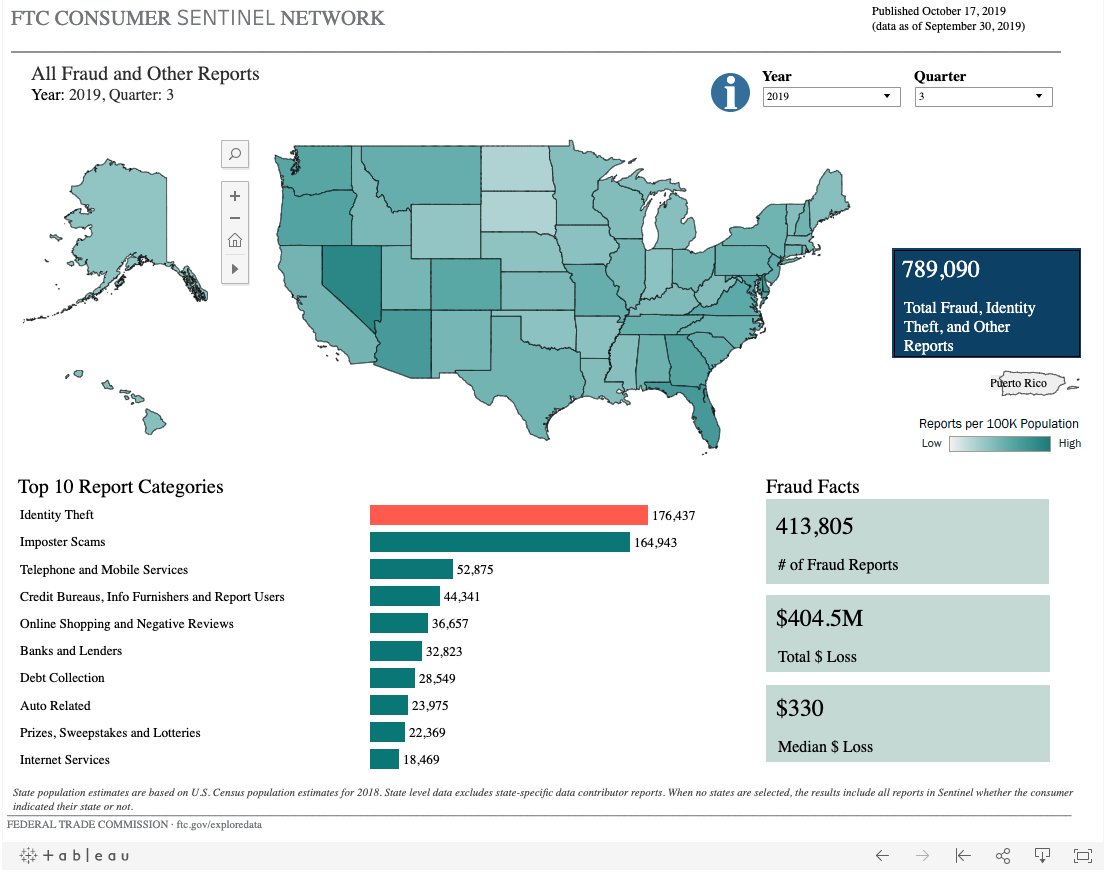
But, if you’re building an app for which farming out data representation might expose customer or client data, you cannot give the data to a third party and hope for the best. You have to do the visualization and own the testing of the app. .
Dynamic Content Tests With Legacy Tools
In Chapter 4 of Raja Rao’s course, Modern Functional Test Automation thorugh Visual AI on Test Automation University, Raja walks through an example graphing app built with Canvas and asks:
“How would you test this page with dynamic content?”
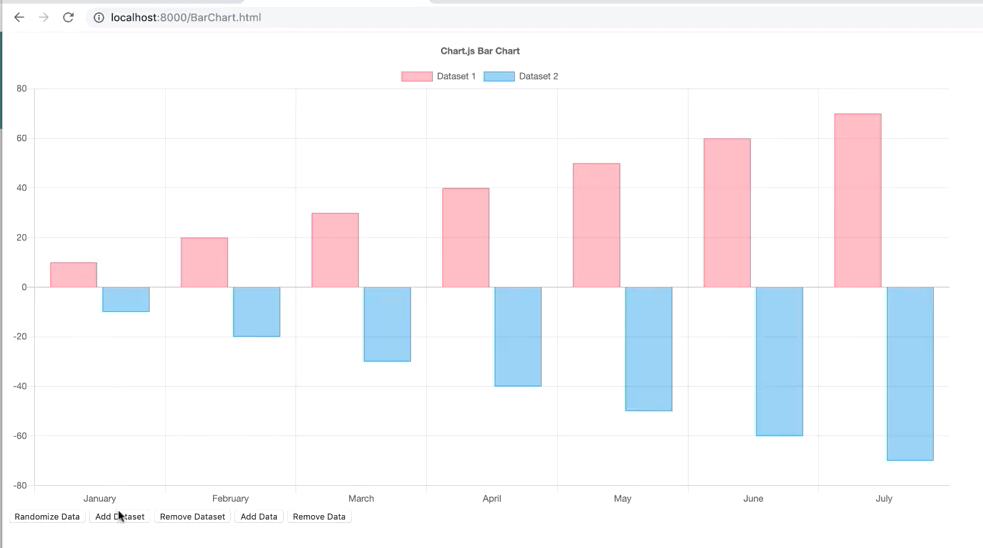
He takes a bar chart example in an app using CanvasJS.
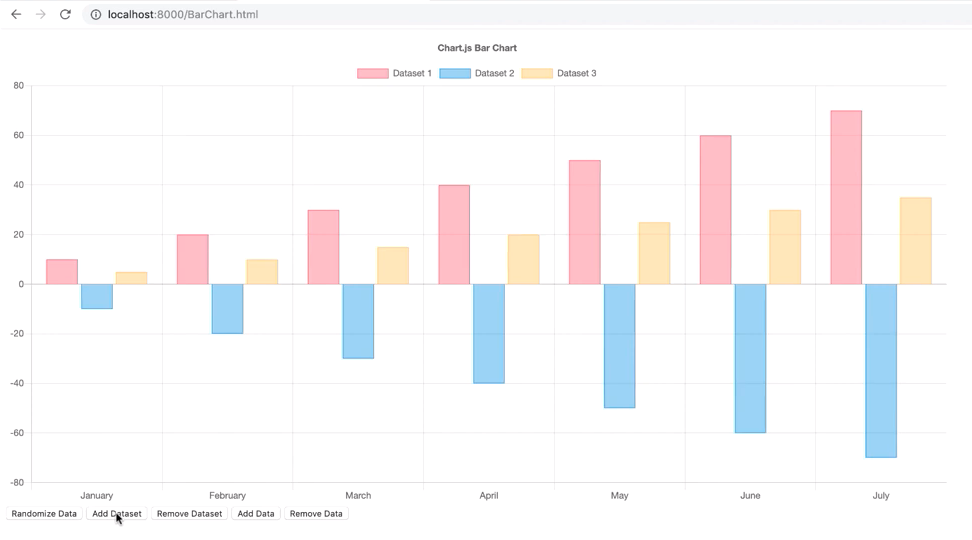
Next, Raja shows what happens when he adds a dataset to the bar chart:
What makes this problem notoriously difficult to test involves the visual nature of the behavior and the lack of handles in the DOM that correlate to the behavior. In fact, there are no links.
Opening up the Inspector for this page shows a canvas link:
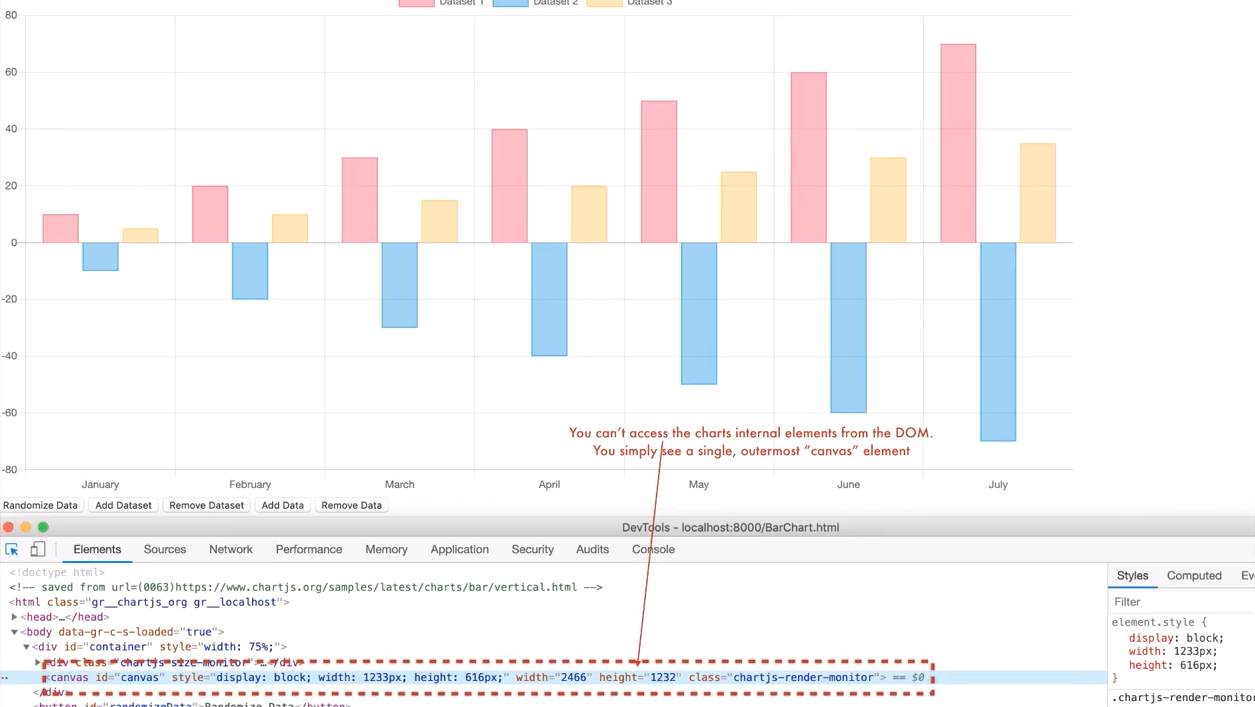
In more detail, it reads:
<canvas id=”canvas” style=”display: block; width: 1233px; height: 616px;” width=”2466” height=”1232” class=”chartsjs-render-monitor”> == $0
So, all it shows is the size of the Canvas render – not the internal content. How the heck do you test this dynamic content?
With no DOM hooks, it’s impossible to know that the code above behaves as expected.
How would you handle this kind of test? When we ask, we find out that most people do is either test on occasion or not at all. After all, if you’re using a third-party package, like CanvasJS, why not just trust it and go?
Testing Charts with Visual AI
As Raja points out, with Visual AI, you don’t need hooks in the DOM to capture app behavior. All you need to do is trigger the behavior, then capture the results visually.
Here is the test code he uses to manipulate the test chart:
Hopefully, each step in the code reads clearly for you:
- Open the app
- Capture the screen
- Click the add dataset button
- Wait to make sure the screen executes
- Capture the screen
It seemed pretty straightforward to me when I went through it.
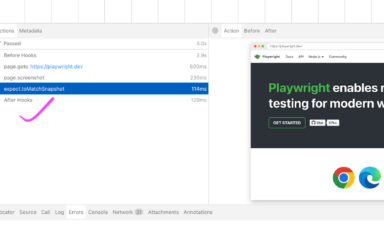
When you run the code, Applitools captures the tests separately as part of the same batch test run:
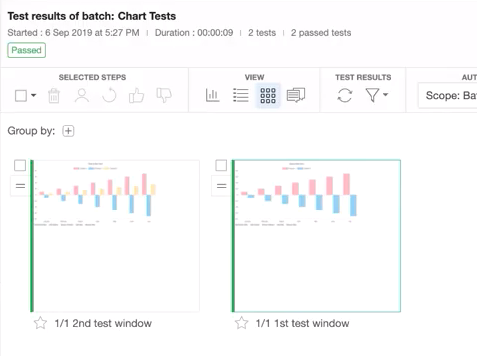
When you start running Applitools on these tests, the first runs get stored as the baseline expected images. You can continue to execute these tests on subsequent builds and have Applitools compare the new checkpoint against the baseline. Applitools will highlight any visual differences.
Why Does Testing Dynamic Content Matter?
In the past, I have been responsible for apps that display lots of data – like the central controller for a bunch of networking equipment. Lots of data and visualization. Each time we thought about improving the visualization, it was a huge headache. Testing alone would swallow up the QA team in apoplectic fits.
In looking at the world of visualization, there are network operations centers.
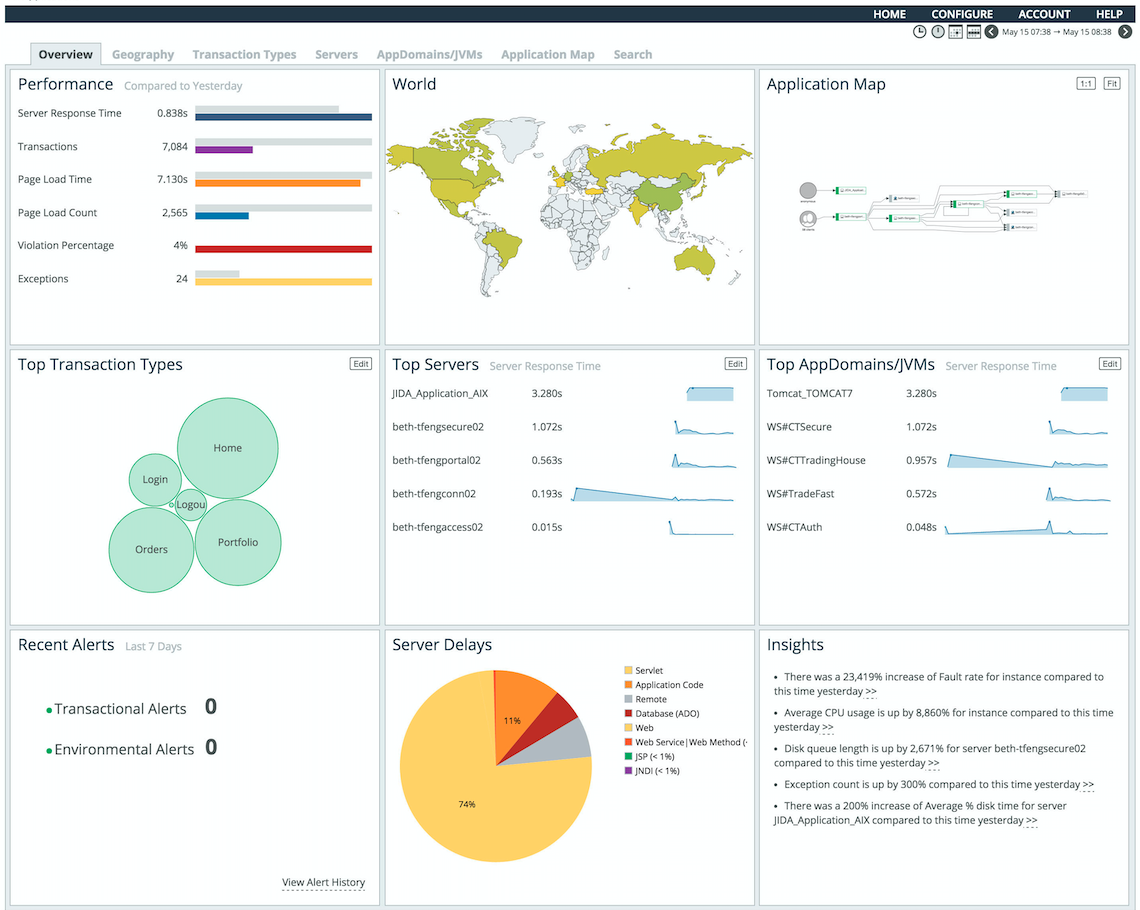
There are financial applications.
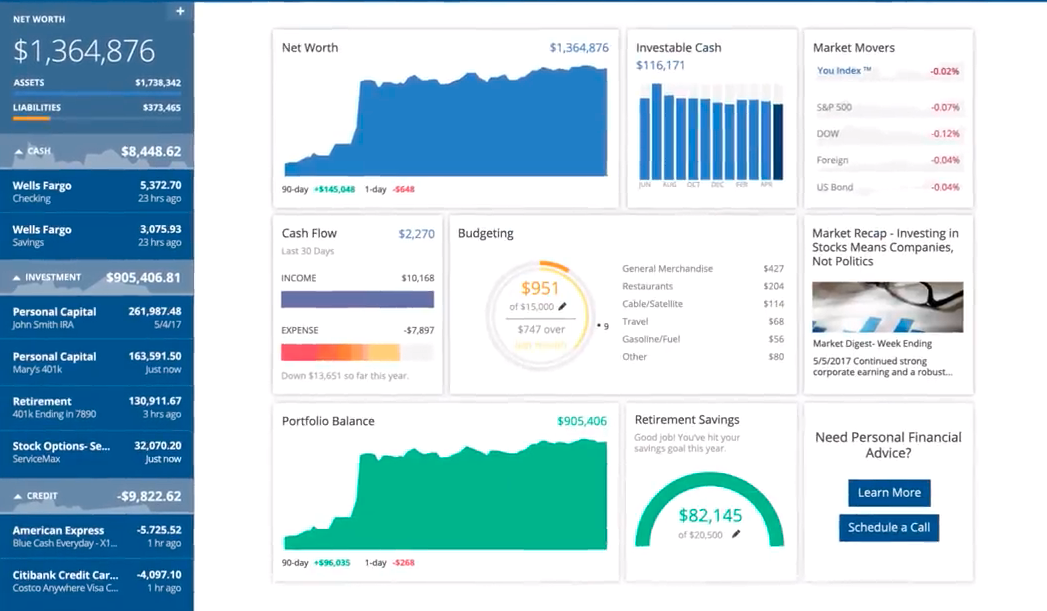
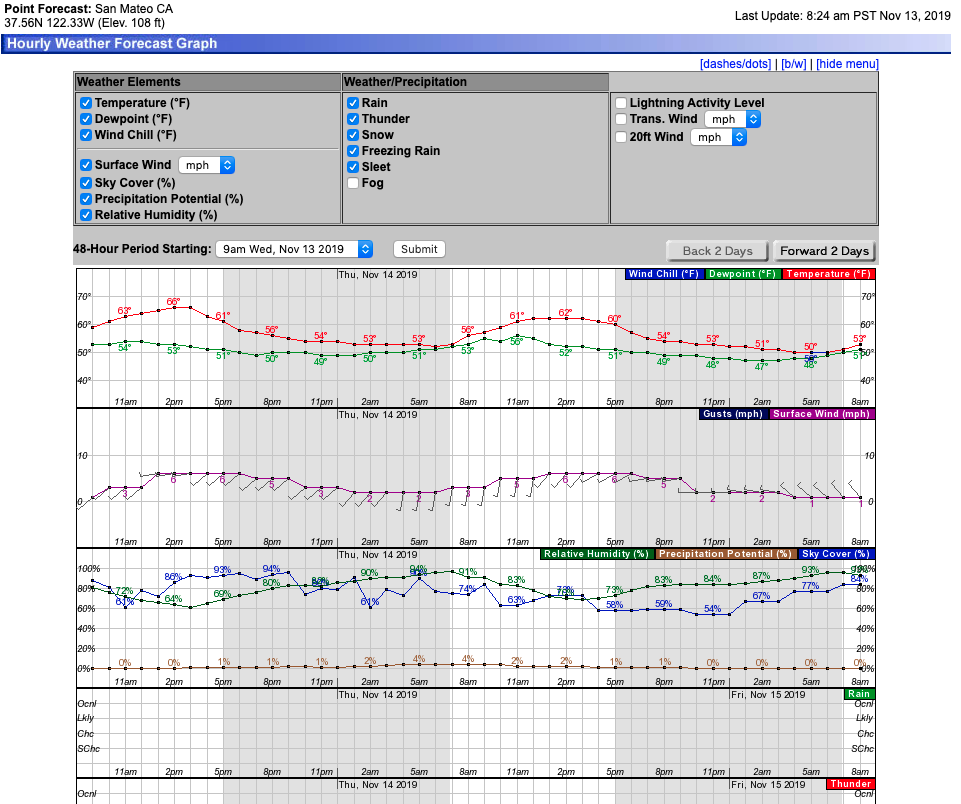
There’s even weather.
Whether you’re handling inventory, forecasting the future, scheduling appointments or doing any number of things with your applications, your customers likely will benefit from data visualizations. Why let the question of test automation limit your decision of whether or not to deploy a great visualization?
Conclusion
Everyone who deals with data needs to represent that data as more than a bunch of numbers. If you find yourself doing visual representations, you have a choice:
- Code, test, and pray
- Code, test, and spot check
- Test visually and automate tests of dynamic content.
Now that you have a way to test this dynamic content, what’s stopping you?
For More Information
- Sign up for Test Automation University
- Read all about Functional Test Myopia
- Modernize Your Functional Testing– Chapter 1 of Raja’s course.
- Advanced Tools for Testing Tables – Chapter 2 of Raja’s course.
- Data-Driven Testing with Visual AI – Chapter 3 of Raja’s course.
- Visit the Automated Visual Testing Course on Test Automation University
- Blog: How Do I Validate Visually?
- Sign up for a free Applitools account
- Request an Applitools Demo
- Visit the Applitools Tutorials