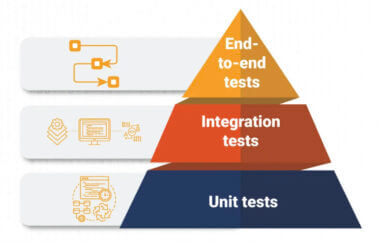
There are many metrics that drive the efficiency of an engineering team. These are easier to meet when your team is small but after the team crosses 50 engineers, it is reasonably hard to manage engineering productivity. Most engineering managers spend all their time ensuring that the team does not have bottlenecks. The north star for teams is usually some well defined metrics at this stage. We interviewed a group of 20 engineering managers from leading companies in Australia and India to find the ones that are really important to their success. These are the ones we found are most important to them.
Cycle Time
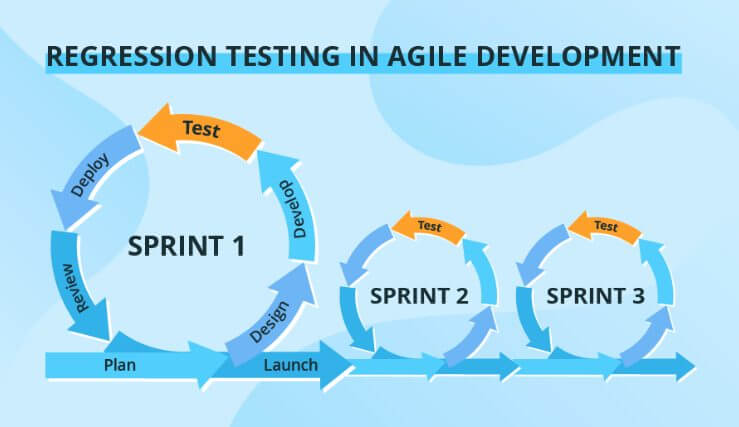
Cycle time is a universal engineering metric that determines how effective a team is. A group must spend a certain amount of time on a feature from start to finish. Usually this includes planning, development, and testing. The metrics measure how quickly the development team can deliver the feature but it may not necessarily be deployed to production.
Faster cycle time is a goal for every development team. The ability to monitor cycle times allows engineering managers to identify potential bottlenecks in the delivery process. A lot of compromises are sometimes made to meet higher cycle time as agility is very important to every business today.
Deploy Frequency
You can determine how often your team can release code into production by calculating the deployment frequency. Note that cycle time does not include deployment time. Teams working on development aim to distribute smaller pieces of code more frequently and in smaller batches.
It allows deployments to be more manageable to test and release. It also improves your overall efficiency.
Rework Ratio
This appears to be the most important metric for many teams and happens to also be a big area of concern. The rework ratio indicates the amount of code that must be changed after the team delivers it to production. The rework can be a bug or feature enhancement. If you have a high rework percentage, it can reduce your overall efficiency.
Meeting high deployment frequency and cycle time can create an impact on the amount of testing done to push to production. This can lead to higher rework ratio as issues get raised by users later in the cycle. Any bug raised later leads to lost time in fixing old code which reduces the overall efficiency of the team.
An insufficient level of communication or a flawed review process could lead to quality issues in the future.
Context Switching
As a result of various obstacles, team members must switch between issues in context. When the team switches context frequently, they are not working efficiently. To maintain focus, the appropriate adjustments should be made in this case. A huge reason for context switching is the process around fixing bugs in the development process. Sometimes the development process makes development teams use tools that make it hard to remain in the context of the development process. Most of the times, it is the testing cycle that leads to context switching due to the lack of adequate integrations across the development lifecycle.
As you may have observed, there is one common thing that we found becomes an obstacle in achieving better engineering productivity metrics. The desire to drop cycle time and deploy frequently is usually done at a compromise of testing coverage. Eventually, it leads to more rework ratio and more context switching for the teams. Most teams that scaled their engineering process start by paying acute attention to the testing process. The idea is to automate what can be automated with tools that can allow developers to move faster.
Testing fast and at scale is the key to engineering efficiency. Spotify coined the term for this called “Quality at Speed”. To maintain Quality at Speed, a Quality Engineering counterforce is required. At Applitools, our customers have helped in achieving quality at ultrafast speed. Visual AI from Applitools provides you with the ability to extend human eyes on the testing process without having to increase the QA/Dev ratio in the team. Some quotes from engineering managers that have used Applitools for building products include:
“Any engineering team can reduce the manual testing resource and time by at least 70%. It also avoids overloading of SDETs.”
Engineering Manager at Dunzo (India)
“At Pushpay, our success stems from a technology-forward culture which drives our behavior, how we solve problems, and what tools we use to solve them. Since partnering with Applitools over 5 years ago, we have been able to improve quality, gain productivity and thus save time and money. We could not be more pleased with the efficiency boost our team has experienced since adopting Applitools and more recently, the Ultrafast Grid.”
Engineering Manager at Pushpay (New Zealand)
Using visual AI to address these factors
If the above is something you wish to improve within your team, then you will be surprised that it takes just a few days to get to this degree of speed at quality.
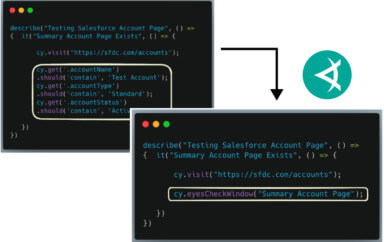
The picture below shows how Applitools integrates with your application.
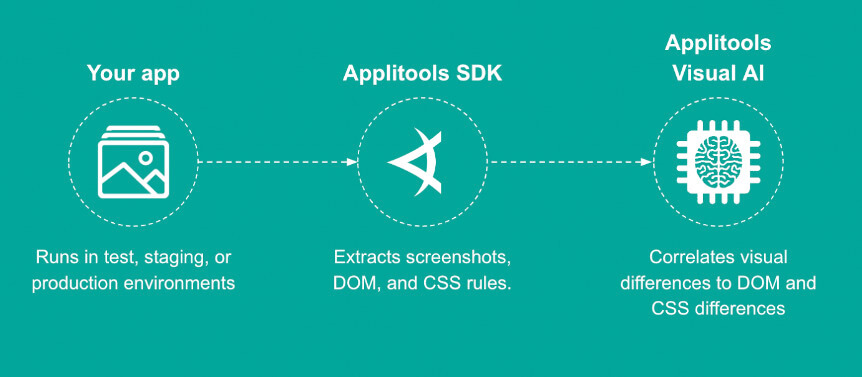
I will not get into how to install Applitools, as that is fairly well described in the tutorials. This also includes how you can integrate Applitools within your CI/CD pipeline. In the remainder of this article, I will like to tell you about some great examples of improving these metrics using Applitools.
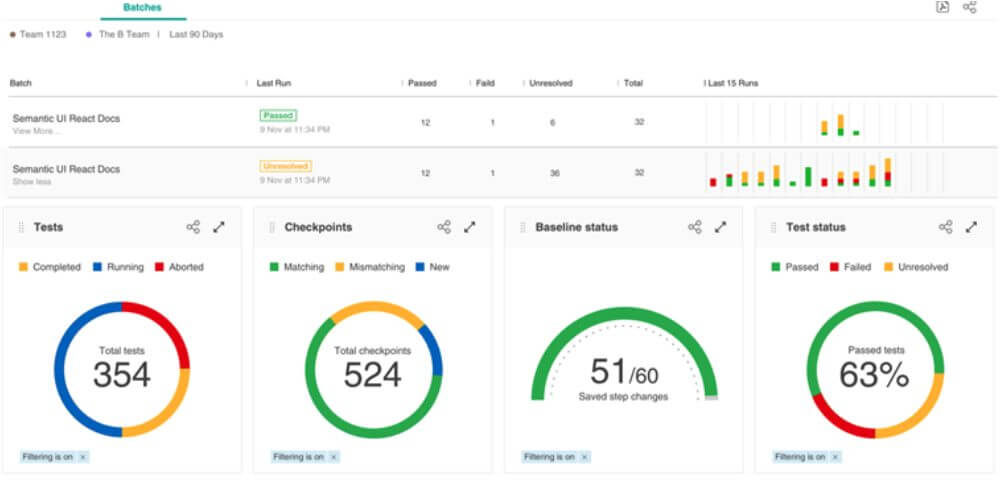
Most efficient teams would start a day with the below dashboard. This gives you a comprehensive view of all your tests that have been executed across your entire coverage list. Having high coverage is made easy by using an ultrafast grid that reduces your rework ratio later for devices or browsers that may not have been included before. At last a number of re-work happens due to poor coverage of testing in the first phase of development. Of course there is an element of scope creep that leads to the re-work as well which can be easily avoided by involving cross-functional teams in the development process. Applitools provide a visual abstraction of your application that can be accessed by everyone on a GUI. This drastically brings down the areas of scope creep unless the requirements have totally changed by business.
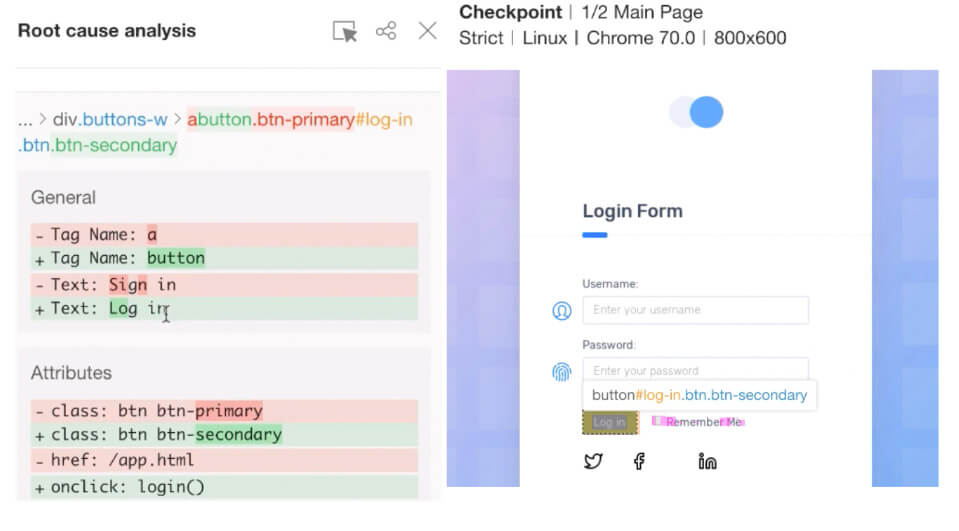
When you are doing testing for high coverage it becomes important that you are not getting slowed down by the process of reviewing the bugs. A big reason why deployment frequency gets reduced is because of the time it takes to review and fix the issues. This is exactly where Visual AI plays a big role.
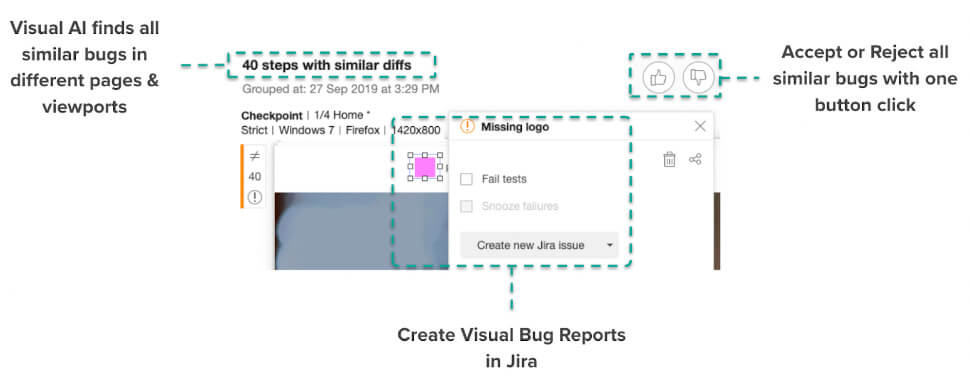
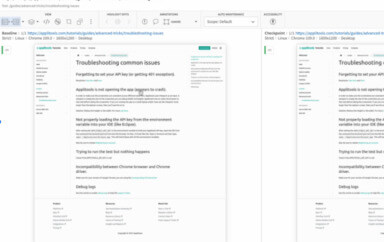
Visual AI also lets you troubleshoot the defects really quickly.
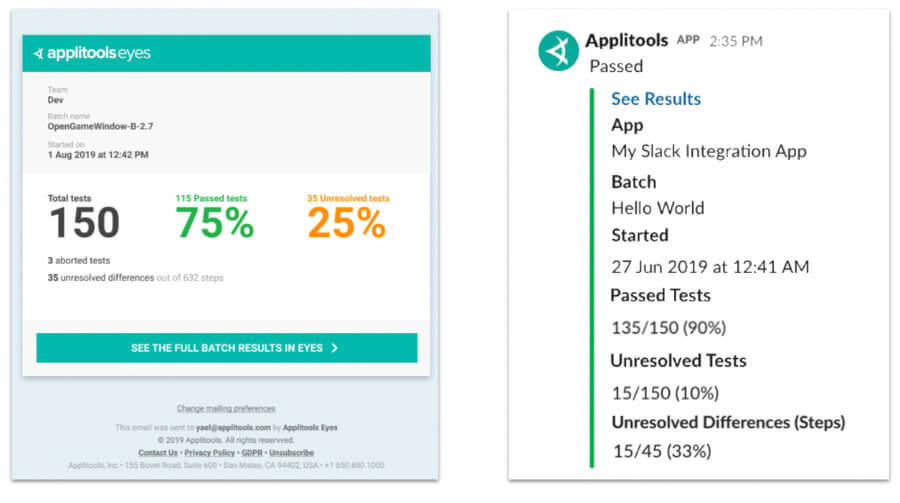
Finally, developers and testers can use the same platform which integrates seamlessly with Jira or their preferred communication channel for faster feedback. Email and Slack notifications help the team get the feedback fast without any context switching.
To conclude, the engineering manager needs to explore more deeply how engineering processes are structured as the engineering team grows. Businesses are demanding faster releases of standard quality products, and Visual AI is an effective method of improving both efficiency and coverage of testing.
Learn about more about visual AI with Applitools Eyes.