There are many record and playback tools available, such as Selenium IDE, Testim, Katalon, and others.
Just recently Google has decided to launch its own Recorder tool embedded directly into Chrome. When Google joins the game it’s interesting to see. We decided to check it out.
The new tool is called Chrome DevTools Recorder.
What Is Chrome DevTools Recorder?
Chrome’s new Recorder tool allows you to record and replay tests from the browser, export them as a JSON file (and more), as well as measure test performance. The DevTools Recorder was released in November 2021, and you can read all about it here.
Right off the bat, we were excited to see that the tool is straightforward and simple. Since it is embedded in the browser we have the convenience of not having to context switch or deal with an additional external tool.
Let’s see what Google has in store with us with the tool and check out just how easily and quickly we can run our first test.
We’ll do so by recording a test on the Coffee cart website and exporting it as a Puppeteer Replay script. To top it off, we will be sprinkling some Applitools magic onto it and see how easy it is to integrate visual testing into the new tool. Let’s go!
First things first, let’s open up our new tool and record a test.
How to Record a Test with Chrome DevTools Recorder
- Open this page. We will be using this demo page for recording
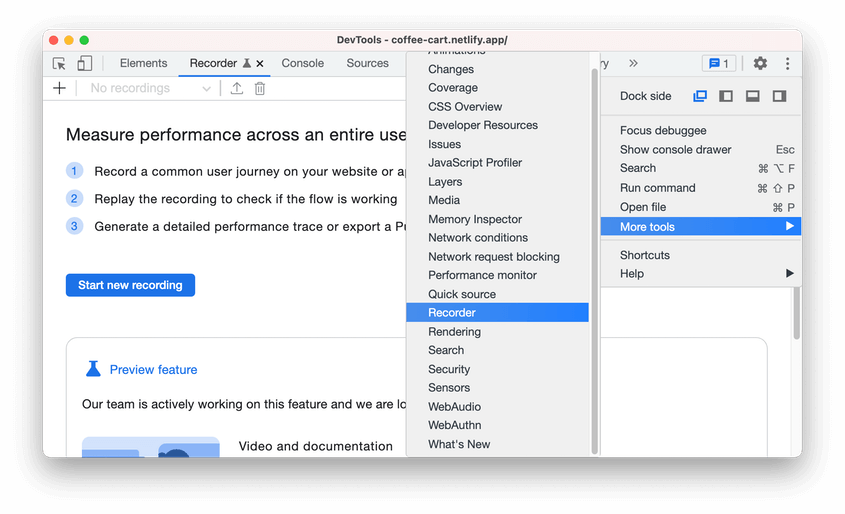
- Open Chrome DevTools
- Click on More options(
) > More tools > Recorder
- Click on the Start new recording button to begin
- Enter your recording name
- Click the Start a new recording button at the bottom of the recording window
- The recording is started (the panel is showing Recording… indicates the recording is in progress)
- Try to click around and order some coffees
- Every interaction with the webpage is now recorded – clicking on buttons, switching web pages, waiting for elements to load and much more
Once the recording is done, we have our first automation script ready to run.
Given the recording, we can see some options before us:
- Replay the recording – playback what was recorded.
- Measure performance – replays the tests and opens the new Performance insights panel or the Performance panel of the DevTools. This way we can analyze the performance of our test, the amount of time it took to load each resource.
- Edit and add steps – we can manually edit our tests and add steps, even complex ones (e.g. wait until 9 images have been loaded and then continue the test). All without code.
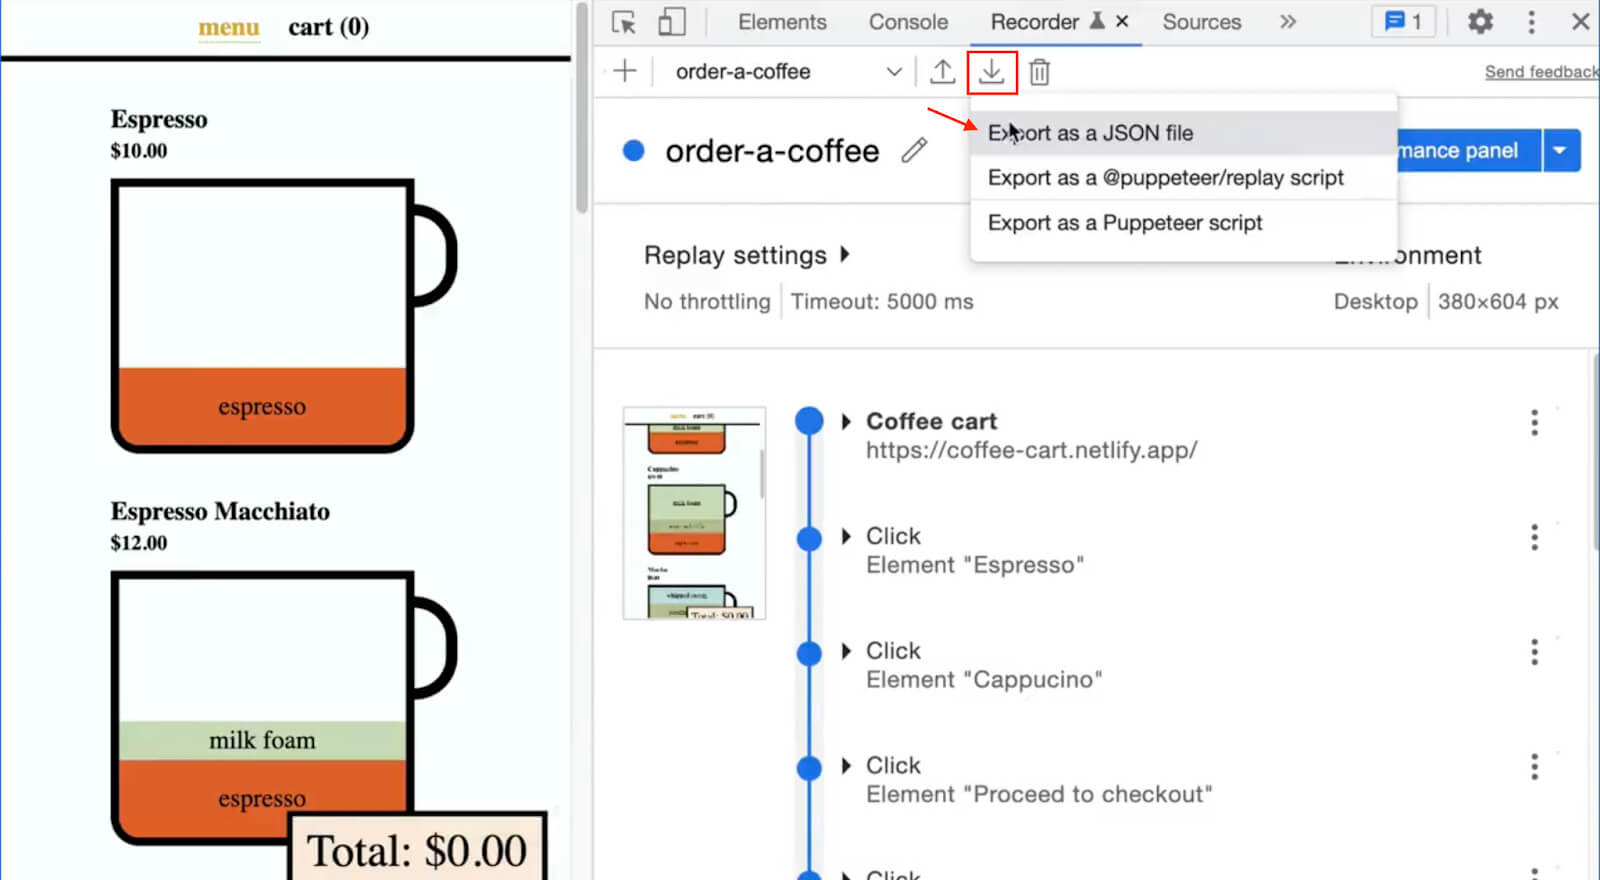
Lastly, we have the option to export the test as a JSON file. This is a great feature as you can share the files with other users.
You can also export it as a Puppeteer Replay script right away. It allows you to customize, extend and replay the tests with the Puppeteer Replay library, which makes the tool even more useful for more experienced users.
One of the main ‘weaknesses’ of Chrome’s Recorder tools is the very basic validation and a pretty standardized flow, with no option in the UI to add on top of it.
The ability to quickly record a stable automated test and export it to make it more customizable is an incredible feature. It can help create tests quickly and efficiently.
Downloading the Puppeteer Script
- Click on the Export button in the Recorder panel
- Click on the Export as a @puppeter/replay script and save it as
main.mjs(we will customize this file to add in Applitools visual testing) - Also click on the Export as a JSON file as shown below (we will customize our script later to read from this JSON file)
Understanding the Puppeteer Replay script
Open the main.mjs file we exported just now. This is what the script looks like:
import url from 'url';
import { createRunner } from '@puppeteer/replay';

export const flow = {
    "title": "order-a-coffee",
    "steps": [
        {
            "type": "setViewport",
            "width": 380,
            "height": 604,
            "deviceScaleFactor": 1,
            "isMobile": false,
            "hasTouch": false,
            "isLandscape": false
        },
        ...
    ]
};

export async function run(extension) {
  const runner = await createRunner(flow, extension);
  await runner.run();
}

if (process && import.meta.url === url.pathToFileURL(process.argv[1]).href) {
  await run();
}
After we npm install all the dependencies, we can replay the script above with the node main.mjs command.
The Puppeteer Replay library provides us with an API to replay and stringify recordings created using the Chrome DevTools Recorder.
The flow variable is our recorded test steps. It is a JSON object. You can replace the flow value to read from a JSON file instead. Here is an example:
/* main.mjs */
import url from 'url';
import fs from 'fs';
import { createRunner, parse } from '@puppeteer/replay';

// Puppeteer: read the JSON user flow
const recordingText = fs.readFileSync('./your-exported-file.json', 'utf8');
export const flow = parse(JSON.parse(recordingText));


export async function run(extension) {
  ...
}

...
Run the script again. It returns the same result.
Extend the Puppeteer Replay script
The Puppeteer Replay offers a way to customize how a recording is run using the PuppeteerRunnerExtension class, which introduces very powerful and simple hooks such as beforeEachStep and afterAllSteps.
Puppeteer must be installed to customize the tests further. For example, the tests will launch in headless mode by default. In order for us to see how the browser runs the automated test we can turn it off.
Below you can see an example on extending this class and running in headful mode:
/* main.mjs */
...
import puppeteer from 'puppeteer';
import { PuppeteerRunnerExtension } from "@puppeteer/replay";

// Extend runner to log message in the Console
class Extension extends PuppeteerRunnerExtension {
  async beforeAllSteps(flow) {
    await super.beforeAllSteps(flow);
    console.log("starting");
  }

  async afterEachStep(step, flow) {
    await super.afterEachStep(step, flow);
    console.log("after", step);
  }
}

// Puppeteer: launch browser
const browser = await puppeteer.launch({ headless: false });
const page = await browser.newPage();

// Puppeteer: read the JSON user flow
..

// Puppeteer: Replay the script
if (process && import.meta.url === url.pathToFileURL(process.argv[1]).href) {
  // add extension
  await run(new Extension(browser, page));
}

// Puppeteer: clean up
await browser.close();
Now that we understand the code it’s time to kick it up a notch by adding Applitools Eyes to the mix to enable visual testing.
How to add Applitools Eyes to Chrome DevTools Recorder
Applitools Eyes is powered by Visual AI, the only AI-powered computer vision that replicates the human eyes and brain to quickly spot functional and visual regressions. Tests infused with Visual AI are created 5.8x faster, run 3.8x more stably, and detect 45% more bugs vs traditional functional testing.
Applitools also offers the Ultrafast Grid, which provides massively parallel test automation across all browsers, devices, and viewports. With the Ultrafast Grid, you run your test setup script once on your local machine, then the Applitools code takes a snapshot of the page HTML & CSS, and sends it to the grid for processing. This provides an out-of-the-box solution for cross-browser tests, so you don’t have to set up and maintain an in-house QA lab with multiple machines and devices.
Incorporating Applitools Eyes into Chrome DevTools Recorder only takes a few steps. Here’s an overview of the process, with the full details about each step below.
- Install Applitools Puppeteer SDK
using npm:npm i -D @applitools/eyes-puppeteer - Add the eyes-puppeteer dependency:
const {Eyes, Target, VisualGridRunner, BrowserType, DeviceName} = require('@applitools/eyes-puppeteer')
Eyes – the Eyes instance
Target – Eyes Fluent API
VisualGridRunner – using the Ultrafast Grid (UFG) with Eyes
BrowserType – UFG browsers configuration
DeviceName – UFG devices configuration - Initialize Eyes and set the desired configuration and browsers for the UFG
- We must first open Eyes in order to perform visual validations – the browser must be defined for this step
- Perform visual validation with Eyes in the
afterEachStephook - Finally, after closing the browser we can close Eyes and gather the test results
- to run the test, run the command:
node <path_to_test.js>
Step 1 – Install Applitools Puppeteer SDK
As indicated above, to install the Applitools Puppeteer SDK run the following command:npm i -D @applitools/eyes-puppeteer
Step 2 – Dependencies
/* main.mjs */
import { Eyes, Target, VisualGridRunner } from '@applitools/eyes-puppeteer';
/* applitools.config.mjs */
import { BrowserType, DeviceName } from '@applitools/eyes-puppeteer';Step 3 – Instance and Configuration
We define an Eyes instance alongside a Visual Grid runner, which is used with Applitools Ultrafast Grid. We can use the runner at the end of the test to gather all the test results across all Eyes instances in the test, therefore, the runner is defined globally. Eyes is usually defined globally as well but may also be defined locally for a specific test case. The terminology for a test in Applitools is equivalent to opening Eyes, performing any number of visual validations, and closing Eyes when we’re done. This will define a batch in Applitools that will hold our test, meaning we can have multiple tests in a single batch.
/* main.mjs */
// Puppeteer: launch browser
...
// Applitools: launch visual grid runner & eyes
const visualGridRunner = new VisualGridRunner({ testConcurrency: 5 });
const eyes = new Eyes(visualGridRunner);
We then create a function, setupEyes, that will set our configuration to Eyes before starting the test and before opening Eyes.
/* applitools.config.mjs */
import { BrowserType, DeviceName } from '@applitools/eyes-puppeteer';
export async function setupEyes(eyes, batchName, apiKey) {
eyes.setApiKey(apiKey);
const configuration = eyes.getConfiguration();
configuration.setBatch({ name: batchName })
configuration.setStitchMode('CSS');
// Add browser
configuration.addBrowser({ width: 1200, height: 800, name: BrowserType.CHROME });
configuration.addBrowser({ width: 1200, height: 800, name: BrowserType.FIREFOX });
configuration.addBrowser({ width: 1200, height: 800, name: BrowserType.SAFARI });
configuration.addBrowser({ width: 1200, height: 800, name: BrowserType.EDGE_CHROMIUM });
configuration.addBrowser({ width: 1200, height: 800, name: BrowserType.IE_11 });
configuration.addBrowser({ deviceName: DeviceName.Pixel_2 });
configuration.addBrowser({ deviceName: DeviceName.iPhone_X });
eyes.setConfiguration(configuration);
};
Step 4 – Opening Eyes
In this step we open Eyes right after initializing the browser and defining the page. The page is required in order to communicate and interact with the browser.
/* main.mjs */

// Applitools: launch visual grid runner & eyes
...
const apiKey = process.env.APPLITOOLS_API_KEY || 'REPLACE_YOUR_APPLITOOLS_API_KEY';
const name = 'Chrome Recorder Demo';

await setupEyes(eyes, name, apiKey);
await eyes.open(page, {
  appName: 'Order a coffee',
  testName: 'My First Applitools Chrome Recorder test!',
  visualGridOptions: { ieV2: true }
});
This is a good opportunity to explain what a Baseline is – A Baseline is a set of images that represent the expected result of a specific test that runs on a specific application in a specific environment. A baseline is created the first time you run a test in a specific environment. This baseline will then be updated whenever you make changes to any of the pages in your app, and accept these changes in Applitools Eyes Test Manager. Any future run of the same test on the same environment will be compared against the baseline.
By default, creating a test on a specific browser for the first time (e.g. Firefox) will create a new Baseline, thus running the same test on a different browser (e.g. Chrome) will form a new baseline.
The baseline is a unique combination of the following parameters:
- OS
- Viewport Size
- Browser
- Application name
- Test name
This means that by default a new baseline will be created for every combination that was not used before.
Step 5 – Visual Validation
By calling eyes.check(), we are telling Eyes to perform a visual validation. Using the Fluent API we can specify which target we would like to capture. Here we are performing visual validation in an afterEachStep hook to validate each step of the replay along the way. The target is specified to capture the window (the viewport) without the fully flag, which will force a full-page screenshot.
/* main.mjs */
...
// Extend runner to take screenshot after each step
class Extension extends PuppeteerRunnerExtension {
  async afterEachStep(step, flow) {
    await super.afterEachStep(step, flow);
    await eyes.check(`recording step: ${step.type}`, Target.window().fully(false));
    console.log(`after step: ${step.type}`);
  }
}
Step 6 – Close Eyes and Gather Results
We must close Eyes at the end of our test, as not closing Eyes will result in an Applitools test running in an endless loop. This is due the fact that when Eyes are open, you may perform any amount of visual validations you desire.
By using the eyes.abortAsync functionality, we essentially tell Eyes to abort the test in case that Eyes were not properly closed for some reason.
/* main.mjs */
...

// Puppeteer: clean up
await browser.close();

// Applitools: clean up
await eyes.closeAsync();
await eyes.abortAsync(); // abort if Eyes were not properly closed
Finally, after Eyes and the browser are closed, we may gather the test results using the runner.
/* main.mjs */
...

// Manage tests across multiple Eyes instances
const testResultsSummary = await visualGridRunner.getAllTestResults()
for (const testResultContainer of testResultsSummary) {
  const testResults = testResultContainer.getTestResults();
  console.log(testResults);
}
You can find the full code in this GitHub repository.
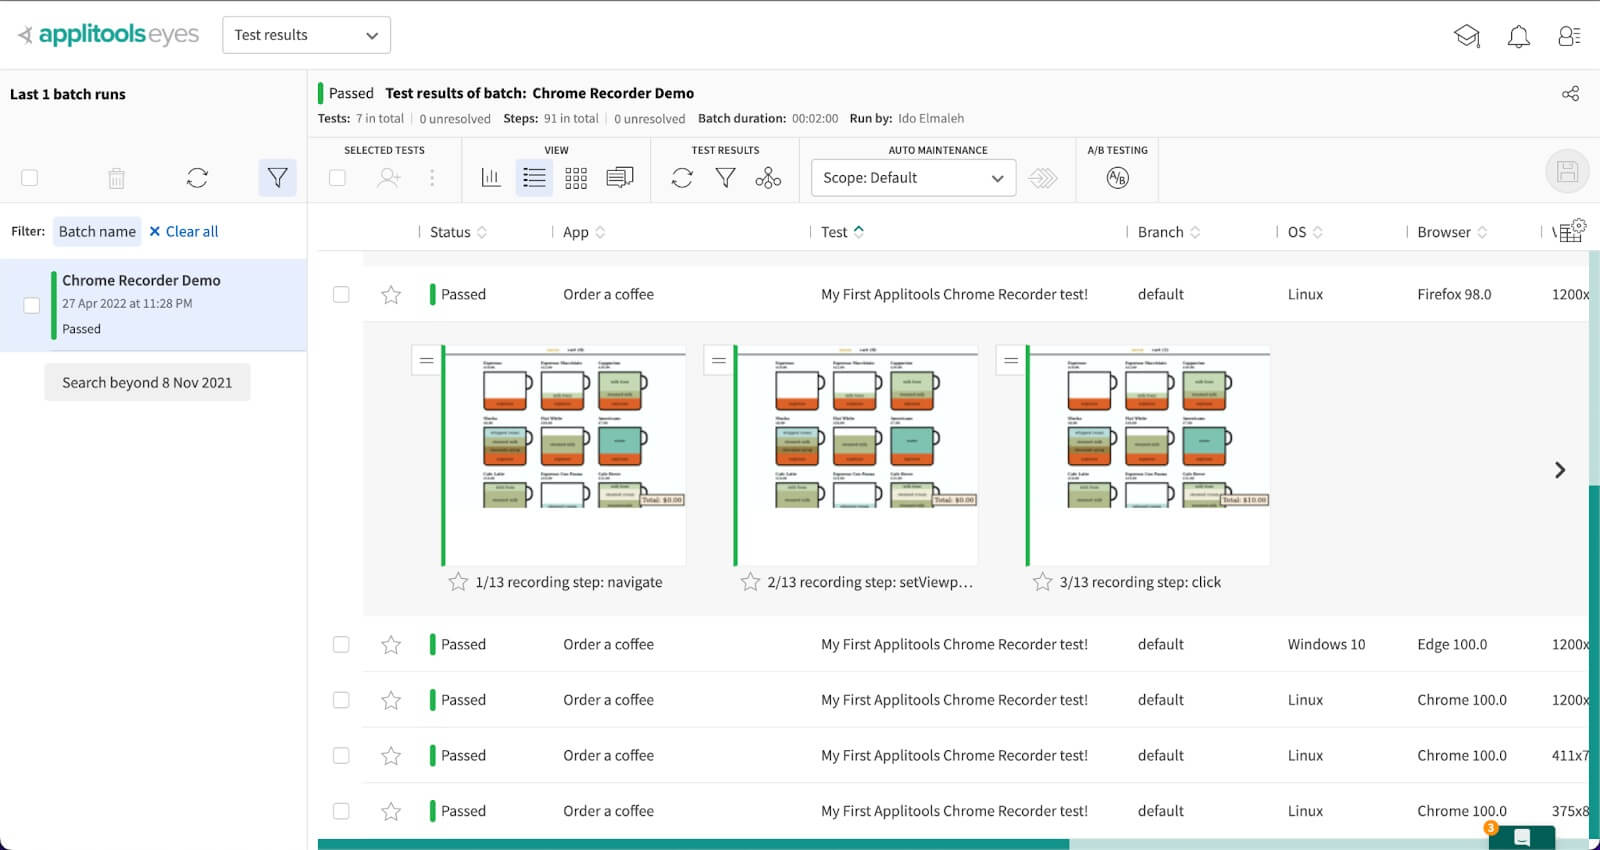
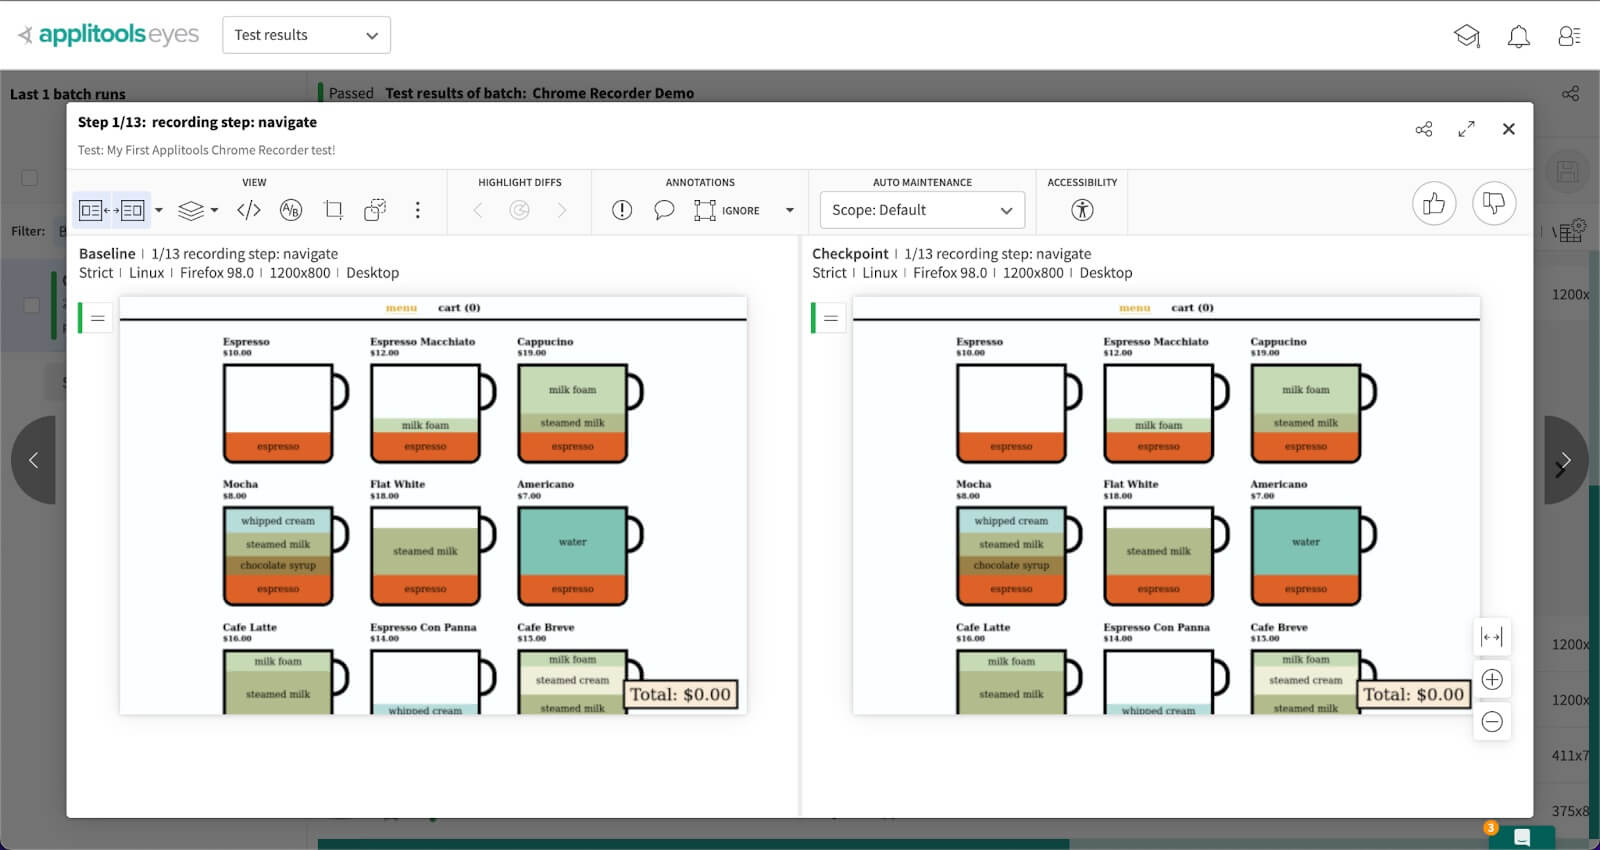
Viewing Test Results in the Applitools Dashboard
After running the test, you’ll see the results populate in the Applitools dashboard. In this case, our baseline and our checkpoint have no visual differences, so everything passed.
Last but not Least – Export Cypress Tests from Google Chrome DevTools Recorder
As we have already mentioned, the ability to quickly record a stable automated test and export it to make it more customizable is an incredible feature. For advanced users, you may also customize how a recording is stringified by extending the PuppeteerStringifyExtension class.
For example, I’d like to introduce you to the Cypress Chrome Recorder library, where you can convert the JSON file into a Cypress test script with one simple command. The library is built on top of Puppeteer Replay’s stringified feature.
We can convert our JSON recording file to a Cypress test with the following CLI command:
npm install -g @cypress/chrome-recorder
npx @cypress/chrome-recorder <relative path to target test file>
The output will be written to the cypress/integration folder. If you do not have that folder, you can get it by installing Cypress with the npm install -D cypress in your project.
Once the test file is ready, we can simply run the test as we would run a standard Cypress test.
Conclusion
Although record and playback testing tools have their setbacks and challenges, this looks like a very simple and useful tool from Google. It can be a good solution for creating simple scenarios or quick tests, seeing how easy it is to use.
What we loved most about the tool was its simplicity. Plain record and playback at the moment with no advanced features, it’s a great stepstone for beginners in testing or even non-code individuals.
Like with any Record-Playback tool one of the challenges is validation. Combined with the ease and speed of adding and running Applitools Eyes you can start validating your UI in no time. Find all the visual regressions and make sure your application is visually perfect.
Applitools Eyes has many advanced features, including AI-powered auto-maintenance, which analyzes differences across all your tests and shows only distinct differences, allowing you to approve or reject changes that automatically apply across all similar changes in your test suite. Learn more about the Applitools platform and sign up for your own free account today.