Selenium IDE & Visual AI
Bring Visual AI to your Selenium IDE scripts.
The Easiest Way to Test
Like most QA professionals, you’re probably crushed with work. Tests to create, tests to run, and bugs to file.
And despite running marathons on the QA treadmill, your test coverage is low. You’ve got untested use cases and untested platforms.
And development? They keep tweaking the UI, making your tests break. Then there’s the good ol’ “can’t replicate” status on bugs you worked hard to find.
Makes you want to take up something easier. Like firewalking.
Superpowers for the New Selenium IDE
If you use Selenium IDE, you know it’s a quick way to record and replay automated test scripts so you can increase your test coverage.
(You might have heard that Selenium IDE was end-of-life’d. Well, rumors of its death were greatly exaggerated. It’s back, has new features for reliable playback, and runs on Chrome and Firefox.)
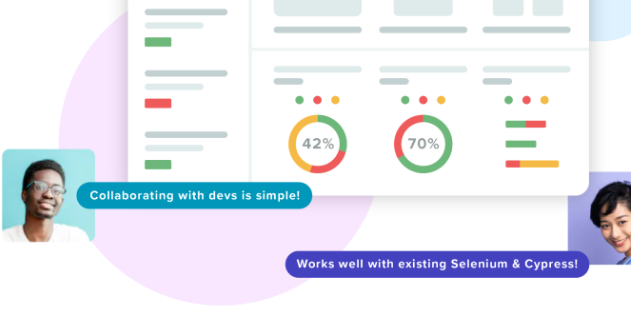
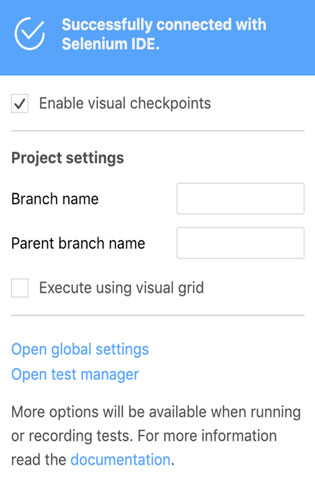
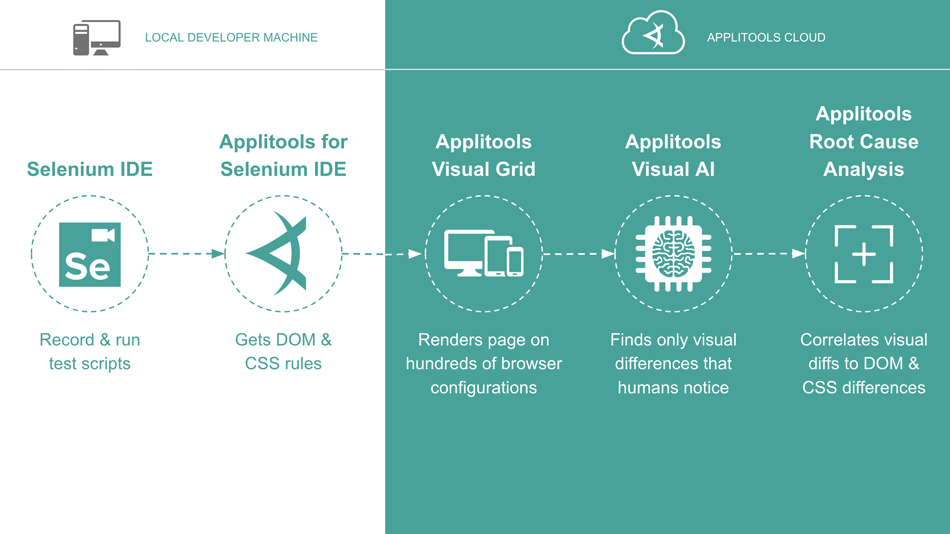
Applitools Eyes for Selenium IDE is a lightweight extension for Chrome and Firefox that works alongside Selenium IDE. Once installed, it lets you add functional and visual checkpoints to your Selenium IDE scripts.
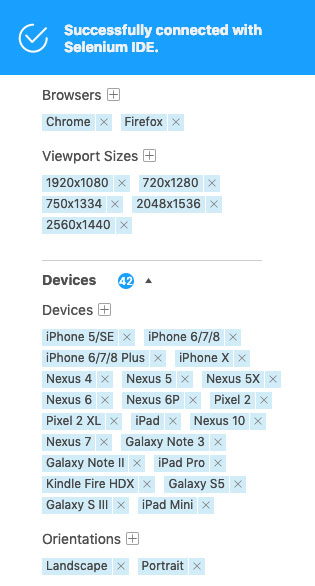
Test on Hundreds of Browser Configurations
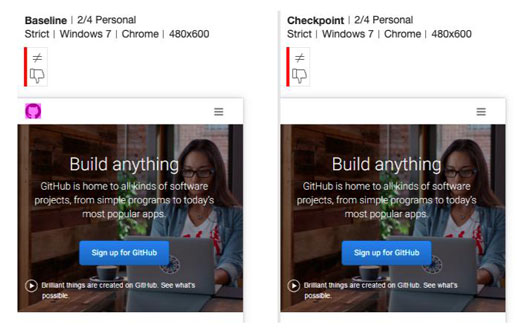
For each checkpoint, Applitools Eyes for Selenium IDE grabs a snapshot of your DOM. All the HTML, CSS, images, and other page components. It then uploads these DOM snapshots to Applitools Ultrafast Grid.
Our Ultrafast Grid then renders them on up to hundreds of different combinations of browsers, viewport sizes, and screen orientations, grabbing a screenshot of each. This lets you test your UI on many of the devices your customers use — and radically increase your platform coverage. Just check off whatever screen size or emulated device you want.
Cross-browser bugs will have nowhere to hide.
All this happens in parallel, so you can see all your app screenshots within seconds of your Selenium IDE script finishing.
Already have an account? Sign in.
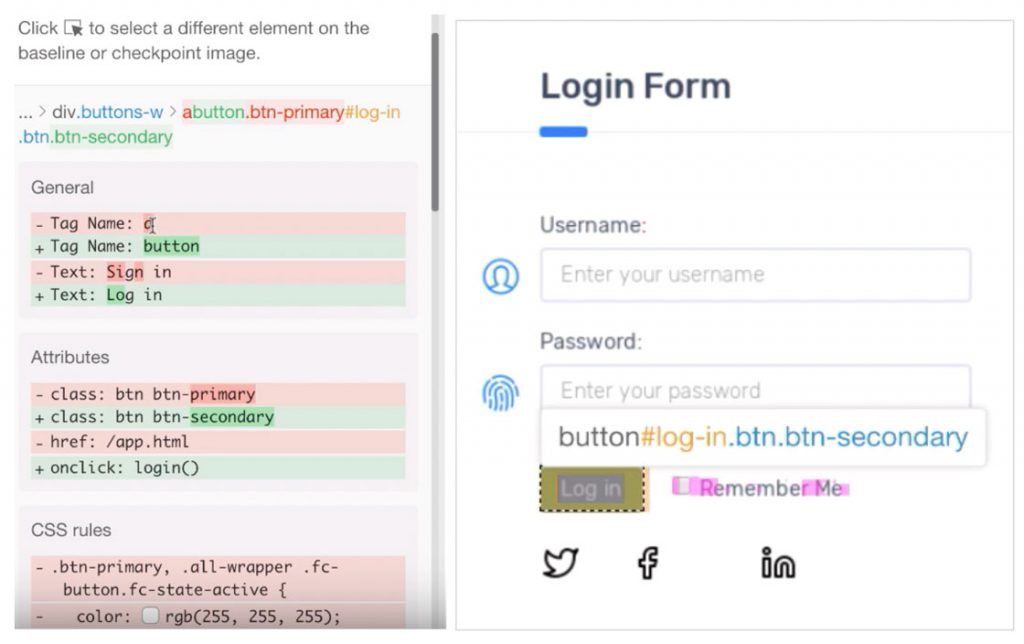
No Distractions from Fake Bugs
Root Cause of Bugs — Instantly
It’s not just enough to FIND a bug. You have to know how to FIX the bug.
We gotcha covered…
For every bug you find with Applitools Eyes for Selenium IDE, our Root Cause Analysis determines the changes in the browser DOM and CSS that caused it. This makes it easy for your developers to re-create a bug — and fix it. This can shorten debugging times from hours to minutes.
How Applitools Works with Selenium IDE
Integrates with Your Continuous Integration
If you’ve used the old Selenium IDE, you’ve seen that it works with Firefox, but not Continuous Integration tools — which meant you couldn’t use it for your DevOps processes.
The new Selenium IDE is also available as a command line tool, called SIDE Runner. A quick install with npm, and you’re off and running Selenium IDE tests from your terminal window — or in your CI build scripts that run in Jenkins, Travis, Circle CI, and so on.
You’ll be finding functional and visual bugs all day, every day.