In the previous post of the Selenium 4 blog series, we discussed some of the new features in Selenium 4.
In this post, we will discuss one of the most anticipated features of Selenium 4 which is the new APIs for CDP (Chrome DevTools Protocol)! This addition to the framework provides a much greater control over the browser used for testing.
I’ll share some of the capabilities of the Selenium 4 CDP APIs as well as practical use cases that can take our tests to the next level!
“The getDevTools() method returns the new DevTools object which allows you to send() the built-in Selenium commands for CDP. These commands are wrapper methods that make it cleaner and easier to invoke CDP functions.”
Shama ugale
But first, what is Chrome DevTools?
Introduction to Chrome DevTools
Chrome DevTools is a set of tools built directly into Chromium-based browsers like Chrome, Opera, and Microsoft Edge to help developers debug and investigate websites.
With Chrome DevTools, developers have deeper access to the website and are able to:
- Inspect Elements in the DOM
- Edit elements and CSS on the fly
- Check and monitor the site’s performance
- Mock geolocations of the user
- Mock faster/slower networks speeds
- Execute and debug JavaScript
- View console logs
- and so much more
Selenium 4 Chrome DevTools APIs
Selenium 4 has added native support for Chrome DevTools APIs. With these new APIs, our tests can now:
- Capture and monitor the network traffic and performance
- Mock geolocations for location-aware testing, localization, and internationalization
- Change the device mode and exercise the responsiveness of the application
And that’s just the tip of the iceberg!
Selenium 4 introduces the new ChromiumDriver class, which includes two methods to access Chrome DevTools: getDevTools() and executeCdpCommand().
The getDevTools() method returns the new DevTools object which allows you to send() the built-in Selenium commands for CDP. These commands are wrapper methods that make it cleaner and easier to invoke CDP functions.
The executeCdpCommand() method also allows you to execute CDP methods but in a more raw sense. It does not use the wrapper APIs but instead allows you to directly pass in a Chrome DevTools command and the parameters for that command. The executeCdpCommand() can be used if there isn’t a Selenium wrapper API for the CDP command, or if you’d like to make the call in a different way than the Selenium APIs provide.
The Chromium-based drivers such as ChromeDriver and EdgeDriver now inherit from ChromiumDriver, so you also have access to the Selenium CDP APIs from these drivers as well.
Let’s explore how we can utilize these new Selenium 4 APIs to solve various use cases.
Simulating Device Mode
Most of the applications we build today are responsive to cater to the needs of the end users coming from a variety of platforms, devices like phones, tablets, wearable devices, desktops and orientations.
As testers, we might want to place our application in various dimensions to trigger the responsiveness of the application.
How can we use Selenium’s new CDP functionality to accomplish this?
The CDP command to modify the device’s metrics is Emulation.setDeviceMetricsOverride, and this command requires input of width, height, mobile, and deviceScaleFactor. These four keys are mandatory for this scenario, but there are several optional ones as well.
In our Selenium tests, we could use the DevTools::send() method using the built-in setDeviceMetricsOverride() command, however, this Selenium API accepts 12 arguments – the 4 that are required as well as 8 optional ones. For any of the 8 optional arguments that we don’t need to send, we can pass Optional.empty().
However, to streamline this a bit by only passing the required parameters, I’m going to use the raw executeCdpCommand() instead as shown in the code below.
On line 19, I create a Map with the required keys for this command.
Then on line 26, I call the executeCdpCommand() method and pass two parameters: the command name as “Emulation.setDeviceMetricsOverride” and the device metrics Map with the parameters.
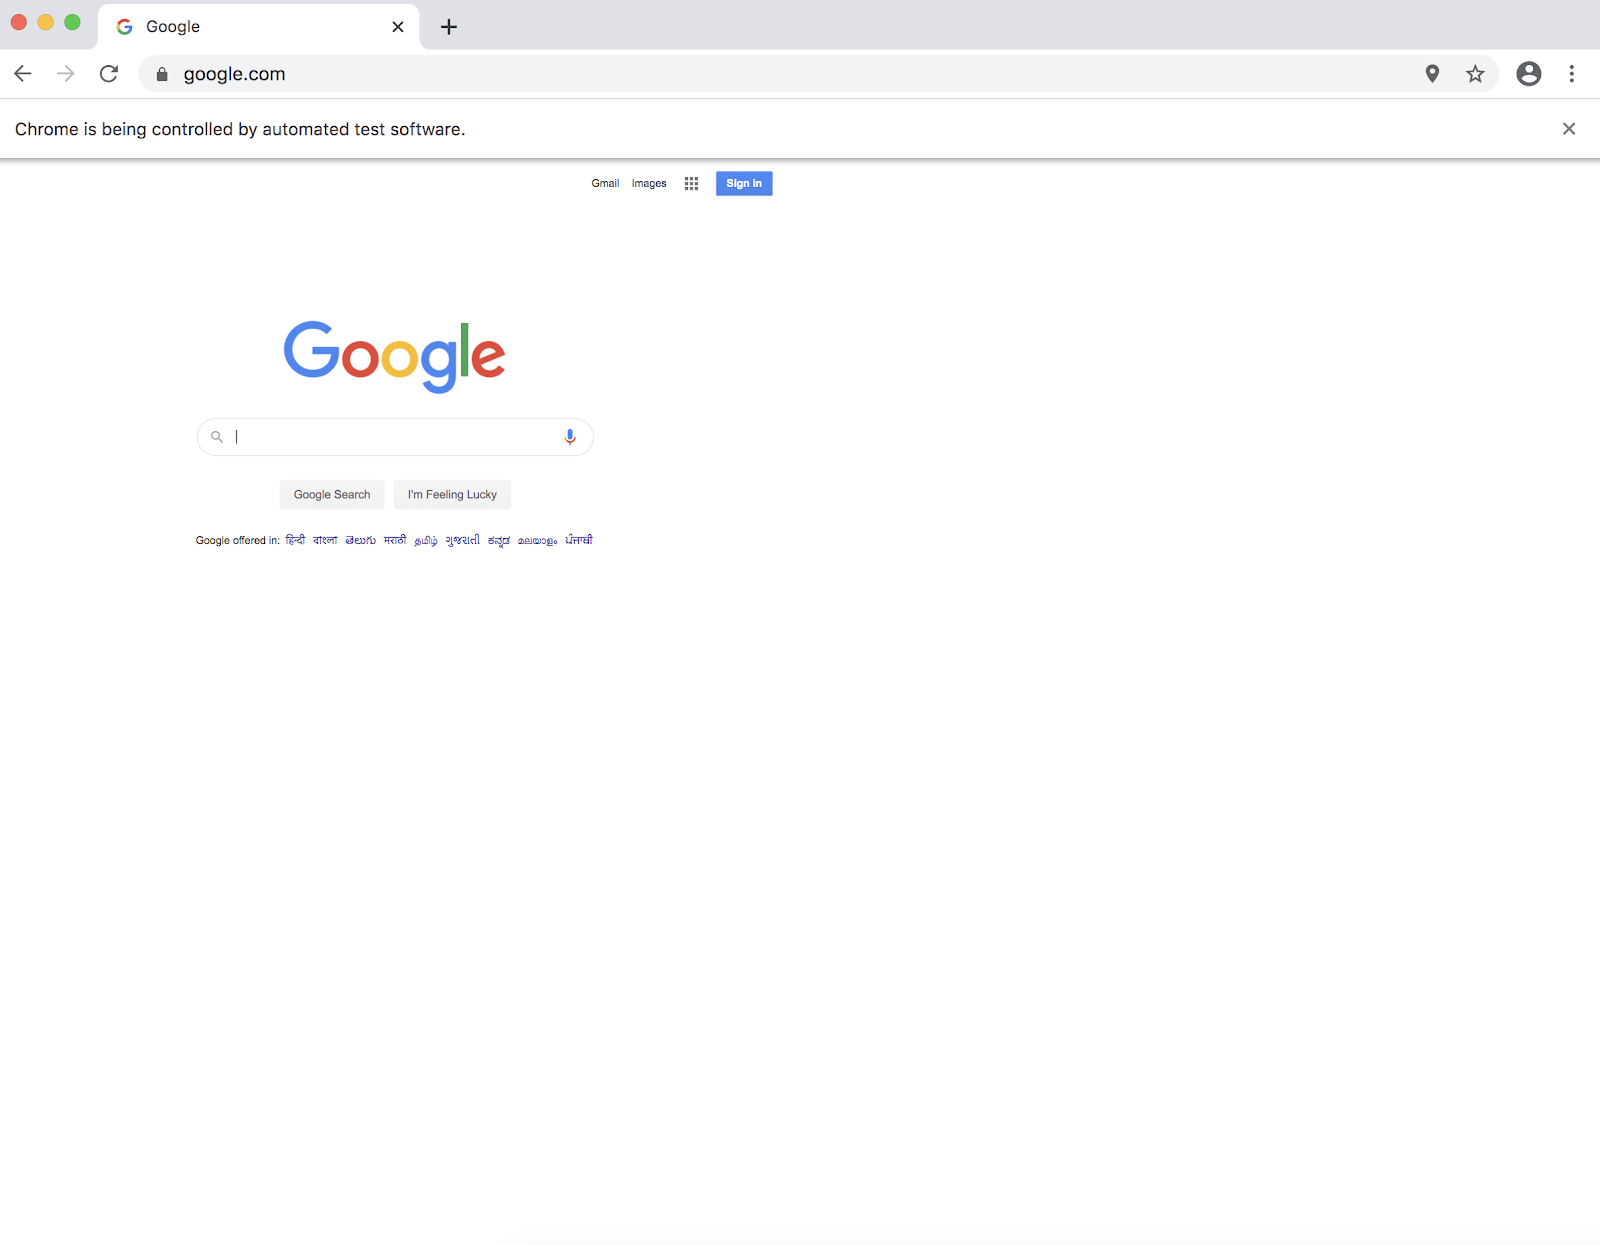
On line 27, I open the “Google” homepage which is rendered with the specifications I provided as shown in the figure below.

With a solution like Applitools Eyes, we can not only rapidly test across these different viewports with these new Selenium commands, but also maintain any inconsistencies at scale. Eyes is intelligent enough to not report false positives for small, imperceivable changes in the UI resulting from different browsers and viewports.
Simulate Network Speed
Many users access web applications via handheld devices which are connected to wifi or cellular networks. It’s not uncommon to reach a weak network signal, and therefore a slower internet connection.
It may be important to test how your application behaves under such conditions where the internet connection is slow (2G) or goes offline intermittently.
The CDP command to fake a network connection is Network.emulateNetworkConditions. Information on the required and optional parameters for this command can be found in the documentation.
With access to Chrome DevTools, it becomes possible to simulate these scenarios. Lets see how.
On line 21, we get the DevTools object by calling getDevTools(). Then we invoke the send() method to enable the Network, and then call send() again to pass in the built-in command Network.emulateNetworkConditions() and the parameters we’d like to send with this command.
Then finally, we open the Google homepage with the network conditions simulated.
Mocking Geolocation
Testing the location-based functionality of applications such as different offers, currencies, taxation rules, freight charges and date/time format for various geolocations is difficult because setting up the infrastructure for all of these physical geolocations is often not a cost-effective solution.
With mocking the geolocation, we could cover all the aforementioned scenarios and more.
The CDP command to fake a geolocation is Emulation.setGeolocationOverride. Information on the required and optional parameters for this command can be found in the documentation.
How can we achieve this with Selenium? Let’s walk through the sample code.
After obtaining a DevTools object, we can use its send() method to invoke the Emulation.setGeolocationOverride command, sending the latitude, longitude, and accuracy.
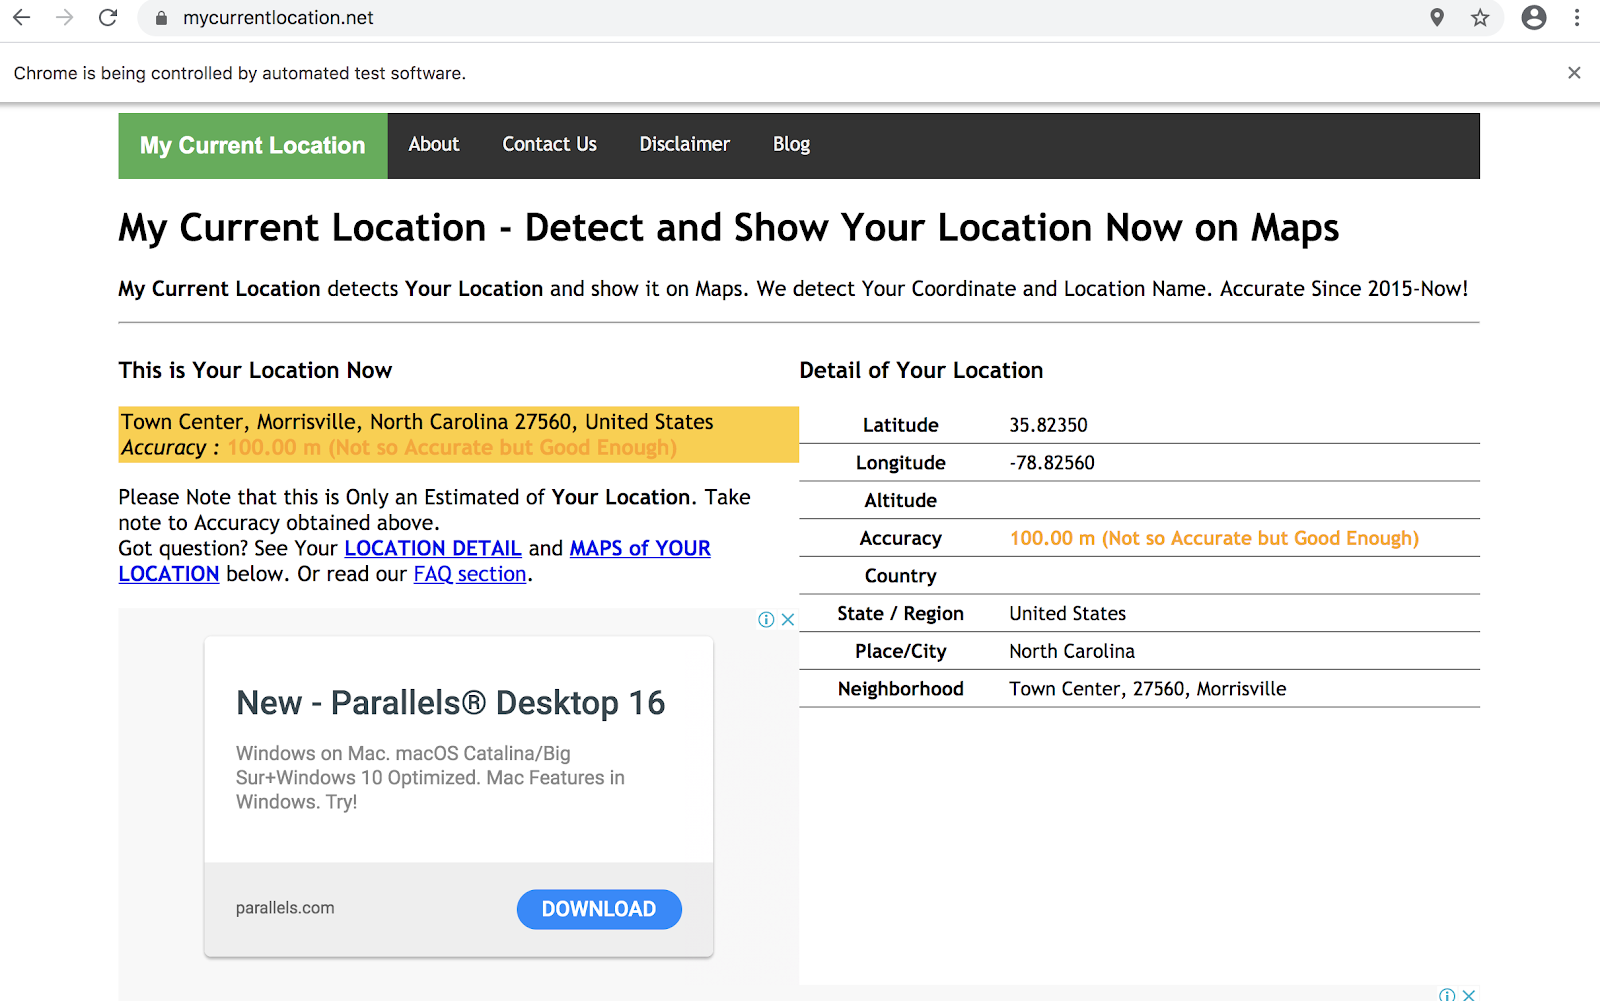
After overriding the geolocation, we open mycurrentlocation.net and see that North Carolina is the detected geolocation.

Capture HTTP Requests
With DevTools we can capture the HTTP requests the application is invoking and access the method, data, headers and lot more.
Lets see how to capture the HTTP requests, the URI and the request method with the sample code.
The CDP command to start capturing the network traffic is Network.enable. Information on the required and optional parameters for this command can be found in the documentation.
Within our code on line 22, we use the DevTools::send() method to send the Network.enable CDP command to enable capturing network traffic.
On line 23, a listener is added to listen to all the requests made by the application. For each request captured by the application we then extract the URL with getRequest().getUrl() and the HTTP Method with getRequest().getMethod().
On line 29, we open Google’s homepage and on the console the URI and HTTP methods are printed for all the requests made by this page.
Once we are done capturing the requests, we can send the CDP command Network.disable to stop capturing the network traffic as shown on line 30.
Access Console logs
We all rely on logs for debugging and analysing the failures. While testing and working on an application with specific data or specific conditions, logs help us in debugging and capturing the error messages, giving more insights that are published in the Console tab of the Chrome DevTools.
We can capture the console logs through our Selenium scripts by calling the CDP Log commands as demonstrated below.
Within our code on line 19, we use DevTools::send() to enable the console log capturing.
Then, we add a listener to capture all the console logs logged by the application. For each log captured by the application we then extract the log text with getText() and log level with getLevel() methods.
Finally, the application is opened and the console error logs published by the application are captured.
Capturing Performance Metrics
In today’s fast world while we are iteratively building software at such a fast pace, we should aim to detect performance bottlenecks iteratively too. Poor performing websites and slower loading pages make unhappy customers.
Can we validate these metrics along with our functional regression on every build? Yes, we can!
The CDP command to capture performance metrics is Performance.enable. Information for this command can be found in the documentation.
Lets see how it’s done with Selenium 4 and Chrome DevTools APIs.
First, we create a session by calling the createSession() method from DevTools as on line 19.
Next, we enable DevTools to capture the performance metrics by sending the Performance.enable() command to send() as shown on line 20.
Once Performance capturing is enabled, we can open the application then send the Performance.getMetrics() command to send(). This will return a list of Metric objects which we then stream to get all of the names of the metrics captured as on line 25.
We then disable capturing the Performance on line 29 by sending the Performance.disable() command to send().
To see the metrics that we are interested in, we define a List called metricsToCheck then loop through this to print the metrics’ values.
Basic Authentication
Interacting with browser popups is not supported in Selenium, as it is only able to engage with DOM elements. This poses a challenge for pop-ups such as authentication dialogs.
We can bypass this by using the CDP APIs to handle the authentication directly with DevTools. The CDP command to set additional headers for the requests is Network.setExtraHTTPHeaders.
Here’s how to invoke this command in Selenium 4.
We begin by using the DevTools object to create a session and enable Network. This is demonstrated on lines 25-26.
Next, we open our website and then create the authentication header to send.
On line 35, we send the setExtraHTTPHeaders command to send() along with the data for the header. This is the part that will authenticate us and allow us to bypass the browser popup.
To test this out, we then click the Basic Authentication test link. If you try this manually, you’ll see the browser popup asking you to login. But since we sent the authentication header, we will not get this popup in our script.
Instead, we get the message “Your browser made it!”.
Summary
As you can see, Selenium has become a lot more powerful with the addition of the CDP APIs. We can now enhance our tests to capture HTTP network traffic, collect performance metrics, handle authentication, and emulate geolocations, time zones and device modes. As well as anything else that is possible within Chrome DevTools!
In the next post of this series, we will explore more new Selenium 4 features such as Observability and enhanced exceptions along with the brand new Selenium Grid 4.
Quick Answers
With the Emulation.setDeviceMetricsOverride command, you can set specific screen dimensions, mobile views, and other parameters to test responsive designs. This enables you to see how your application performs on different devices directly within your tests.
Simulating network speeds, such as slow 2G or intermittent connectivity, helps identify how an application behaves under various real-world conditions. This is especially valuable for mobile users who might experience inconsistent network connections.
You can capture HTTP requests by enabling the network with Network.enable and adding a listener to log requests. This allows you to monitor request URLs, methods, and other details, which can help troubleshoot issues related to API calls or network performance.
Geolocation mocking is useful for testing location-based functionality, like currency, offers, or other regional settings, without physically being in each location. This is achievable with the Emulation.setGeolocationOverride command in the CDP API.
The CDP APIs can be used to simulate device modes, capture network traffic, monitor console logs, manage basic authentication popups, and measure performance metrics. These capabilities help create realistic testing scenarios and improve the reliability of your automated tests.


