The Eyes Usage Dashboard
The Eyes Usage dashboard dashboard provides Eyes account administrators with an overview of how Eyes is being used across the account and by specific teams. You can view information as monthly statistics, as a timeline over a given time range, and in real time. If your Eyes license defines limits to some aspect of usage, the dashboard lets you compare the actual usage to the defined limits, at both the account and team level. For more information about limits, see Account usage limits.
Overview
The following usage metrics are displayed on this dashboard:
- Total number of Page and Component verifications.
- Page and Component verification depends on the SDKs used. Page verifications use SDKs that test a complete application page, for example, Selenium, Espresso, XCUI, Cypress, and Playwright. Component verifications use SDKs that test a specific UI component, such as Storybook.
- Number of verifications out of the total that were executed using the Ultrafast Grid.
- Maximum concurrency used.
- Number of registered team members with user rights and viewer rights.
The Eyes Usage dashboard provides the following metric views:
- Monthly utilization - The utilization of all account limits for a selected month as a proportion of the monthly limit.
- Timeline usage - Usage of a selected metric over a time range.
Accessing the Usage Dashboard Page
-
Navigate to the Admin page. Note that this page is only available if you have Admin privileges.
-
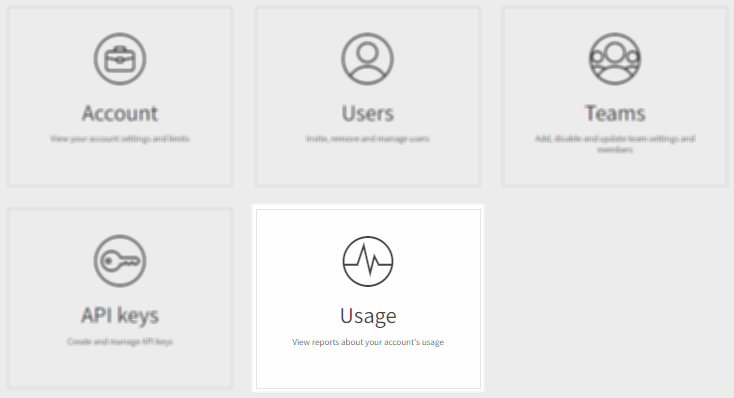
Click on the Usage tile.

-
Click on the Usage overview tab.
This page also has a Page test concurrency tab that displays in real time the current concurrency usage. For further information, see The Concurrency Monitoring page.

Available Metrics
The metrics you see in the Eyes Usage dashboard depend on your account Eyes license type and if the tests use a Page based SDK (for example Selenium or Espresso) or Component based SDK (for example Storybook).
Executive Checkpoints license
This license type counts based on the number of executed checkpoints. This is comparable to the number of steps you see in the Test manager. For this license type, the Usage dashboard displays the following:
- Total page checkpoints - The total number of page checkpoints executed, including pages rendered with the Ultrafast Grid.
- Page checkpoints by Ultrafast Grid - The number of page checkpoints out of the total rendered using the Ultrafast Grid.
- Total component checkpoints - The total number of component checkpoints executed, including components rendered with the Ultrafast Grid.
- Component checkpoints by Ultrafast Grid - The number of component checkpoints out of the total rendered using the Ultrafast Grid.
As a component is generally smaller than a page, the size of a component is limited to 1024 x 768 pixels. If you have a component that is bigger than this size, it will be counted as more than one component.
Verified Page/Component License
This license type is based on the number of active verified pages or components regardless of the number of times each test is run. For this license type, the Usage dashboard displays the following:
- Tested pages - The number of unique active pages verified. A page is considered active if it was tested by Eyes over a 30 day period.
- Tested components - The number of unique active components verified. A component is considered active if it was tested by Eyes over a 30 day period.
For a detailed description of the limits associated with these metrics see Account usage limits.
Execution Cloud Statistics
If you have integration with Execution Cloud, the following statistics are available:
- Total tests ran on the Execution Cloud - The number of tests run on Execution Cloud including both eyes and non-Eyes tests.
- Execution Cloud concurrency - The number of concurrent Execution Cloud tests run.
Monthly Utilization
The upper panel displays the monthly usage of all the metrics that are relevant to your account.

Use the drop down menu to select the month whose monthly utilization you want displayed.
Each metric is shown as a doughnut chart. The outer ring indicates the proportion of the limit that has been used. For example, a 180-degree green ring indicates that you have used half of your account resources. A red shaded ring indicates that you are over the account limit. No ring indicates that there is no limit. The number within the ring shows the usage as a percentage, or if there is no limit, the absolute number of units used.
Timeline View
The timeline pane allows you to select one of the metrics and view how it has been utilized within a time range you can select.

Use the controls at the top of the pane to select:
- Scope - Changes in the metrics at the account level. You can select a subset of items to view.
- Date range - The date range to display.
- Metric - The metric to display.
- Resolution - The resolution of the graph (daily/weekly/monthly). The available options depend on the selected metric.
- Show account/team limit - Whether to display account limits or team limits.