The Insights page
The Insights page provides you with a number of charts that assist you in tracking the performance and effectiveness of tests and batches that teams execute on your account. Reviewing the charts allows managers to identify ongoing trends or risks. The scope of data that you can view is role based. Account admins can view data at the account and team level. Users that do not have admin rights can only view data that relates to the teams for which they are a member.
Generate the charts by specifying the value for two settings:
- Scope - Determines if data is taken with respect to the entire account or one or more teams that are assigned to your account
- Date Range - Sets the time frame boundaries for which the Insights data is collected.
The main tasks that you perform on the Insights page are:
- Setting the scope for which data is displayed, the account or team.
- Setting the date range over which data is displayed.
Page Layout
The Insights page is divided into several sections:
- Insights toolbar
- Tests Analytics tab
- Batch Statistics tab
- Tab toolbar
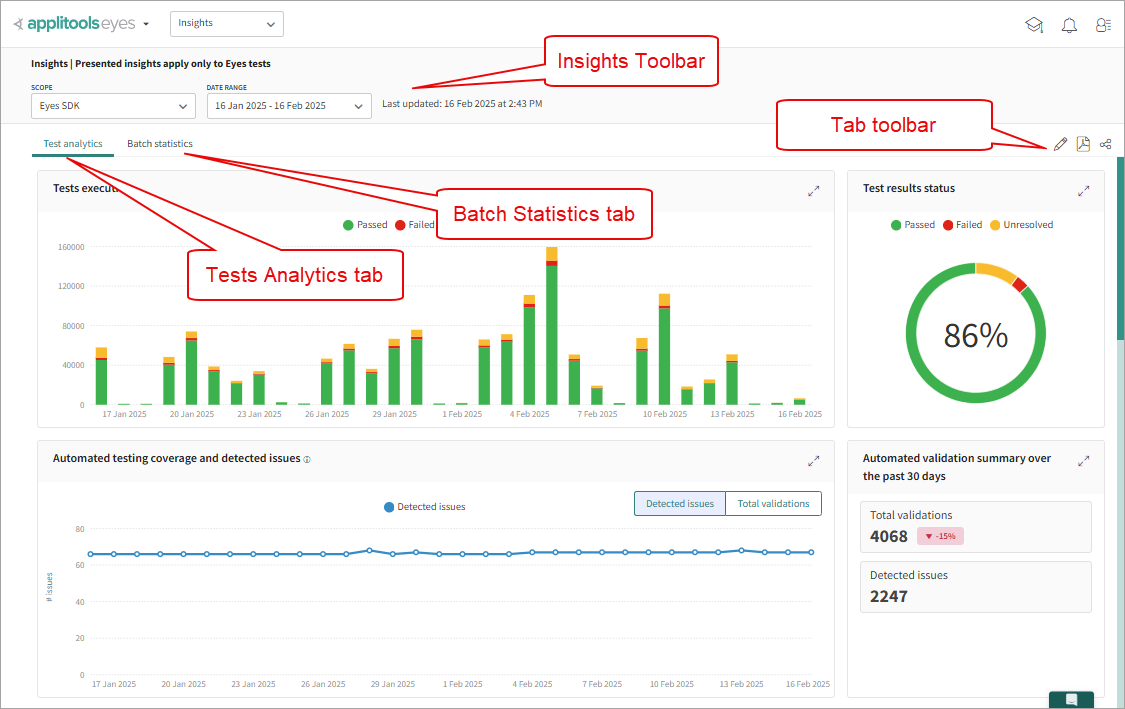
Insights toolbar
Use the toolbar Scope selector to select the account or teams for which information is displayed and the Date Range feature to set the time frame used for extracting information from the database.
Test Analytics tab
Displays a set of charts that provide an at-a-glance view of all executed tests and generated test statistics for the account or for a selection of teams over a selected time frame.
Batch Statistics tab
Displays a list of Batches that were executed over the selected time frame. Each row in the list displays a separate batch and basic batch run and status information such as Last run, Pass, Fail, Unresolved and Total runs. Clicking a row, expands the row to display a set of charts and analytics for that Batch.
Tab toolbar
Contains tools for arranging the display or extracting and sharing information presented on the tab. One or more of the following tools are available depending on the currently active tab:
Arrange display - Click the Arrange display icon and the page changes to allow you to reposition the charts. Drag and Drop the charts into a new position and then click the Arrange display icon again to return to the regular display.
Print PDF - Click the PDF icon to capture the screen, ready to save in PDF format.
Share link - Click the Share link icon to copy a link for the current page to the clipboard. From that point you can share the link.
Setting the Scope
Use the Scope selector to select the account or teams for which information is displayed on the tab. You can choose between displaying reports and charts that reflect test execution for the entire account or for a selection of one or more teams assigned to the account.
To set the scope:
- Click the Scope drop-down list in the Insights toolbar.
- Click the Account option in the list to set the scope to the account.
or
Click the Team option in the list and then select one or more team. - Click Apply to save your selection and update the charts and data presented on the Test Analytics tab.
Setting the Date Range
Applying a date range to the Insights page affects the charts and analytics that the Insights page displays in two ways. First, the period of time over which you sample the tests to produce the charts is increased or decreased to match the date range. Second, based on period of time that you select, Eyes adjusts the number of segments that it displays in the resulting charts so as to clearly present the data. The exact number of time segments that are used varies according to type of information presented in a specific chart.
You can select a date range from several preset date ranges or set a custom date range.
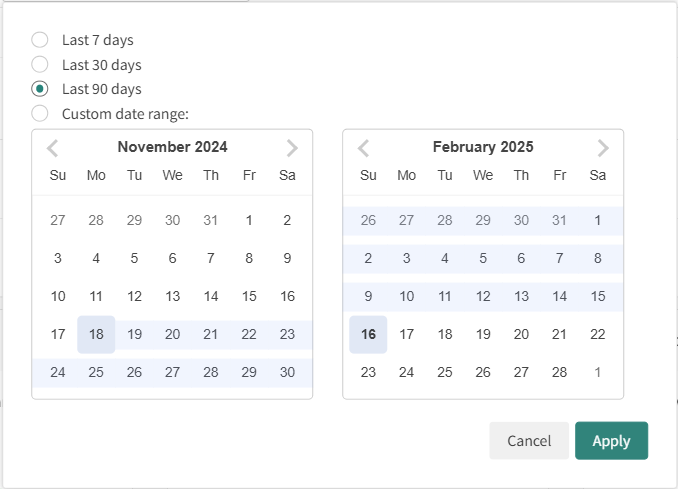
The preset date ranges include the following options:
- Last 7 days
- Last 30 days
- Last 90 days
When you select a Custom date range Eyes opens a standard date picker calendar from which you can select a Start date and End date.
Test Analytics
The Insights - Test analytics tab displays charts that provide an at-a-glance view of test execution data, test results, and test scenarios. The scope for viewing information is role-based, as described in The Insights page. You can view charts by Account or by Teams that you are a member of, and within a selected Date Range.
Tests Execution
This chart shows the number of tests executed within the scope and date range. It provides details of tests by status or by team.
-
The total number of test scenarios executed and broken down by test result status (Passed, Failed, or Unresolved).
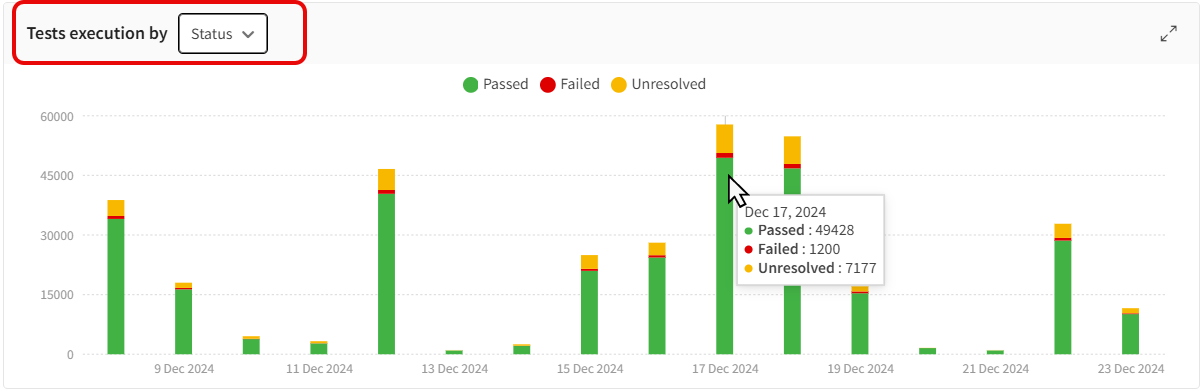
-
The total number of test scenarios executed and broken down by team. This option is not available if the scope is Account.
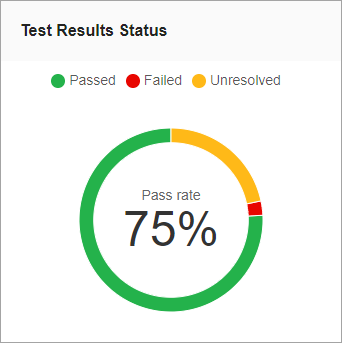
Test Results Status
This pie chart displays the pass rate for all tests executed over a set period. The pass rate is the ratio of passed tests compared to those that did not pass, expressed as a percentage.
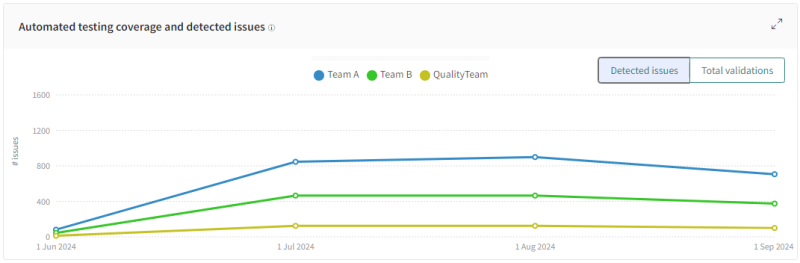
Automated Testing Coverage and Detected Issues
This chart has the following views:
- Detected Issues - Number of steps manually rejected and bug regions added to accepted checkpoints during the selected period.
- Total validations - Number of tested pages and components during the selected period.
If multiple teams are displayed, each team is represented separately on the chart.
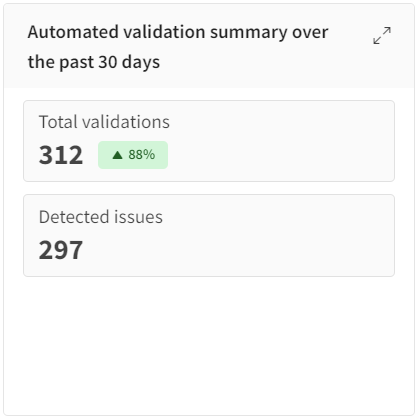
Automated validation summary
This chart shows the number of automated actions over the past 30 days. You cannot modify the time frame in this chart. Automation actions are accept or reject commands or regions that were automatically applied to other screens.
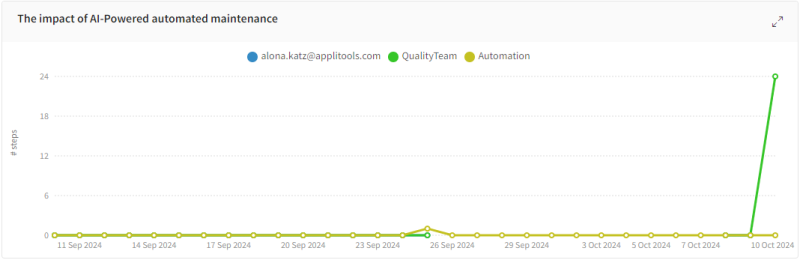
The Impact of AI-Powered Automated Maintenance
This chart shows how many steps were resolved automatically over the selected period.
Time saved with automated maintenance over the past 90 days
This chart calculates the amount of time saved by auto maintenance over the past 90 days and past 12 months. You cannot modify the time frame in this chart.
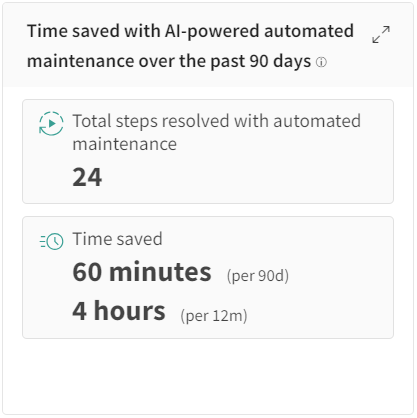
Time saved calculation is based on the assumption that the average time to manually review an app page is 2.5 minutes.
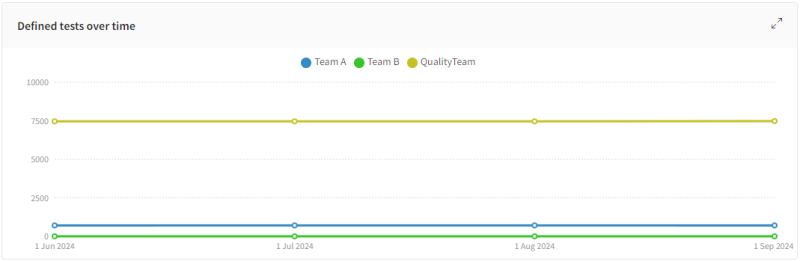
Defined tests over time
Shows the number of tests defined for each interval for the set period of time. If you have multiple teams displayed, each team is displayed separately on the chart.
Display Top....
The Top chart ranks Apps or Tests based on how fragile or stable they are and uses the percentage of executions that passed as the measure of Stability. The higher the percentage of Tests or Apps that pass, the higher the Stability. Conversely, the lower the percentage of Tests or Apps that pass, the more Fragile they are.
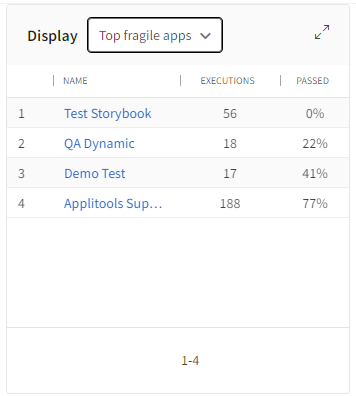
Use the drop-down menu to select one of the following options to display:
- Top fragile apps
- Top stable apps
- Tests with low pass rate
- Tests with high pass rate
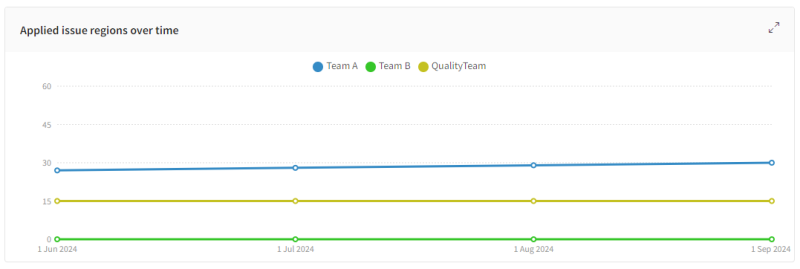
Applied issue regions over time
Shows the cumulative number of bug or comment regions that were added over time. If you have multiple teams displayed, each team is displayed separately on the chart.
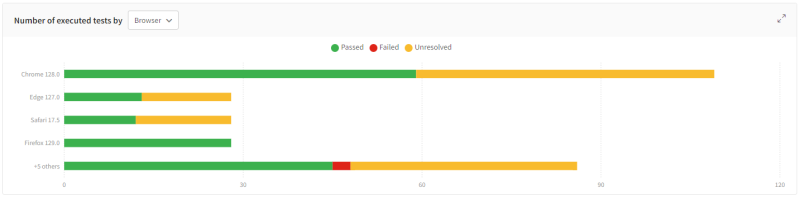
Number of executed tests by...
A bar chart that shows the total number of test scenarios executed with respect to one of the following parameters:
- Assignee
- Browser
- Device
- OS
- Viewport
Batch Statistics
The Batch Statistics tab organizes batches with the same Batch sequence name into chronological order. The tab collects, analyzes, and displays information and statistics for each batch sequence within the Scope and Date Range set on the Batch statistics tab in the Insights page.
For more information about working with batches, see Batching Test runs.
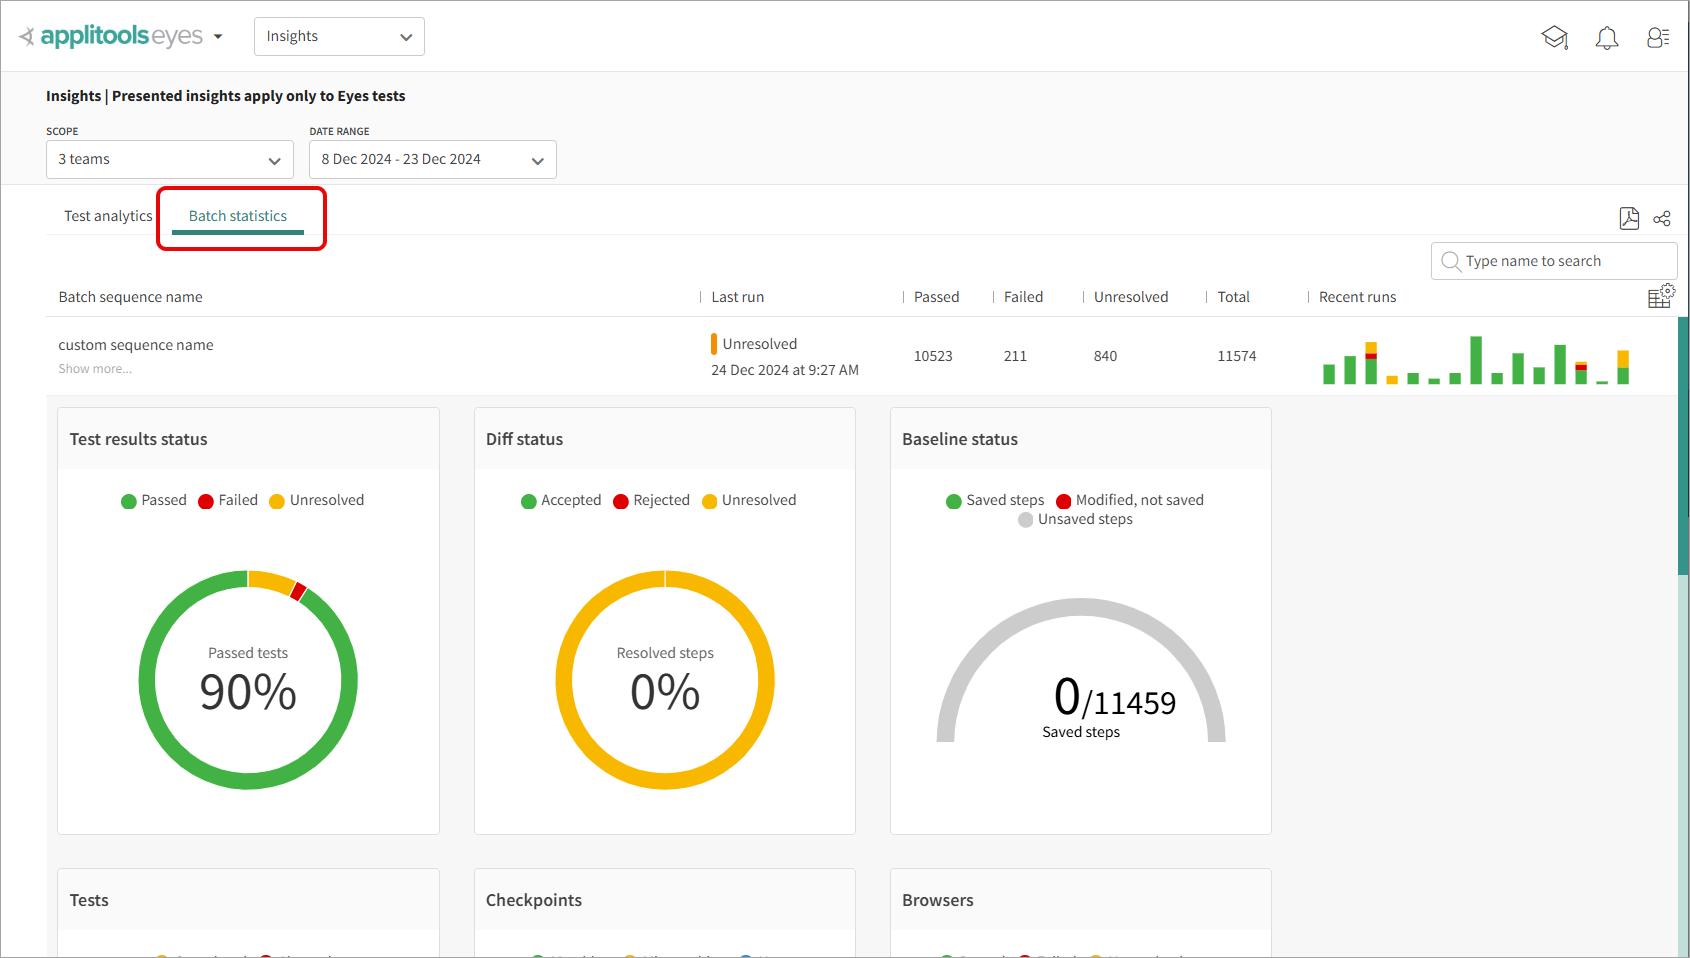
Click one of the sequences in the table to view a more in-depth look at the data behind the performance numbers. You can use the search bar in the top-right corner of the tab to search by batch sequence name.
Test result status
The Test Results Status is a Pie chart that displays the pass rate for all the tests that were executed over a set period of time. The Pass rate represents the ratio of the number of tests that passed as compared to the number of tests that did not pass, expressed as a percentage.

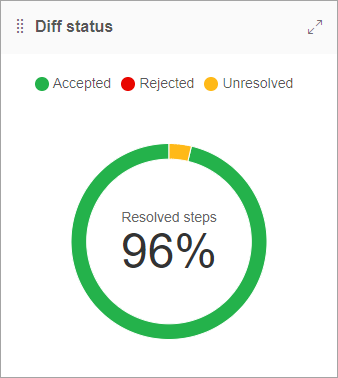
Diff status
A Pie chart that displays the percentage of Diffs that are currently accepted, rejected and unresolved for the selected batch sequence.
Baseline status
Indicates the status of steps and changes on the baseline. Shows the number of Saved steps, Unsaved steps and Unsaved changes.
- Saved steps - Steps saved to the baseline.
- Unsaved steps - Steps that were never saved to the baseline.
- Unsaved changes - Steps with changes not yet saved to the baseline.
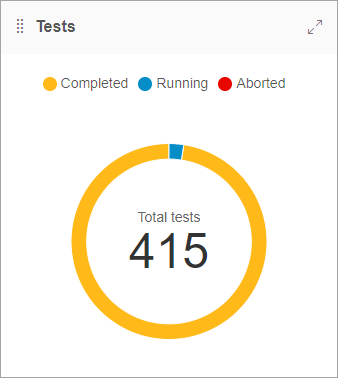
Tests
Indicates the total number of tests in the batch and the number of those tests that are Completed, Running and Aborted.
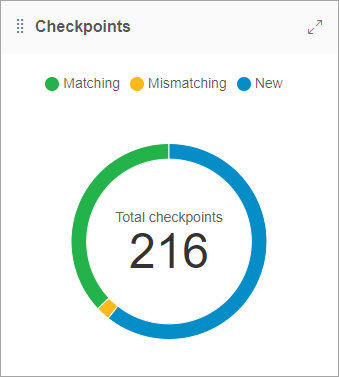
Checkpoints
Indicates the total number of checkpoints executed in the batch and the number of those checkpoints that are Matching, Mismatching or New.
- Matching - Checkpoints with no detected differences.
- Mismatching - Checkpoints with detected differences.
Browsers
A bar chart that shows a bar for each browser on which batches were executed as part of the batch sequence.

Devices
A bar chart that shows a bar for each emulated device for which tests were rendered as part of the batch sequence.

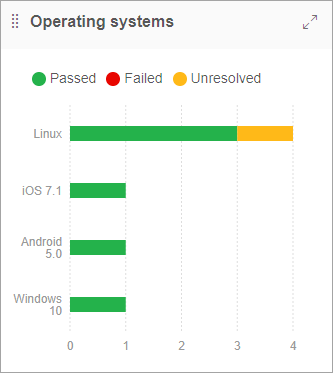
Operating systems
A bar chart that shows a bar for each operating system on which batches were executed as part of the batch sequence.
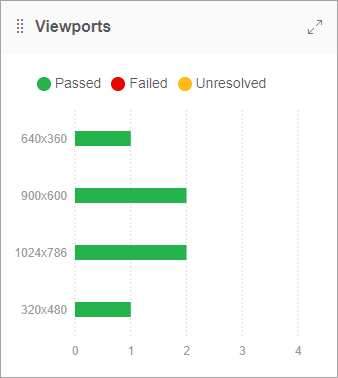
Viewports
A bar chart that shows a separate bar for each Viewport size for which tests were rendered as part of the batch sequence.
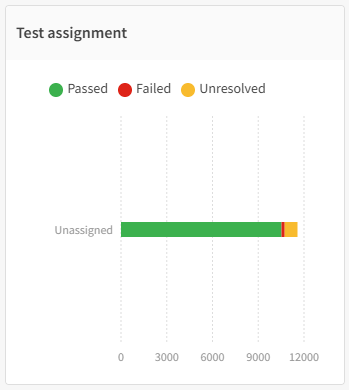
Test assignment
A bar chart that shows a bar for each team member and indicates the number of tests that were assigned toe each team member. Tests that were not assigned to any team member are represented by a bar that is labeled as Unassigned.
Issues and remarks
A bar chart that shows the number of issue and remark regions that are applied in steps that were checked as part of the batch sequence. The Issues and Remarks bars are color-coded to show the number of Issues or Remarks that are New or that were already Existing. If Issue or Remark regions were applied to a batch sampled at a point in time within the set Date Range, then those Issues and Remarks are listed as New.

Setting the Batch Sequence Name
To group batches into a Batch sequence, Eyes requires that batches be associated with a Batch sequence name. The Batch sequence name can be set and associated with a batch in several ways.
-
You can set the Batch sequence name explicitly ins the SDK using the
setSequenceName. Do this when setting up the batch and before callingeyes.open -
If you do not set the Batch sequence name explicitly in the SDK and the environment variable
APPLITOOLS_BATCH_SEQUENCEis defined then the SDK uses the value of that environment variable. -
If you use an Applitools supported SCM or CI integrated plugin then it automatically sets the environment variable to the target branch. This results in batch statistics for each branch.
The batchSequenceName can be configured as shown below:
The following SCM and CI integrated plugins are supported:
Applitools supported SCM applications:
- GitHub
- GitLab
- Atlassian Bitbucket
Applitools supported CI applications:
- Microsoft Azure
- Jenkins
- Bamboo
No batch sequence information page
If no sequenced batches were run in the specified time period, for a given team, then Eyes cannot display any status information or batch statistics in the Batch Statistics tab. In this case, the tab displays information about batch sequences and a link to the documentation that describes how to define batch sequence names.