Applitools Dashboard
The Applitools Dashboard is a powerful web-based tool that allows you to view, analyze, and manage your visual test results. It provides an intuitive interface for reviewing visual differences, updating baselines, collaborating with team members, and gaining insights into your application's UI across different versions and environments.
In this section, we'll explore how to:
- Access the Applitools dashboard
- Acquire your Applitools API key
- Navigate and understand the dashboard interface
- Analyze test results and visual differences
- Manage baselines and approve changes
- Collaborate with your team
- Utilize advanced features like root cause analysis
Accessing the Applitools Dashboard
Step 1: Log in
To access the dashboard:
- Navigate to the Applitools Dashboard.
- Log in with your Applitools account credentials.
If you don't have an account yet, you can sign up for a free account.
Step 2: Acquiring your Applitools API key
Your API key is essential for connecting your tests to the Applitools Eyes cloud service.
How to obtain your API key:
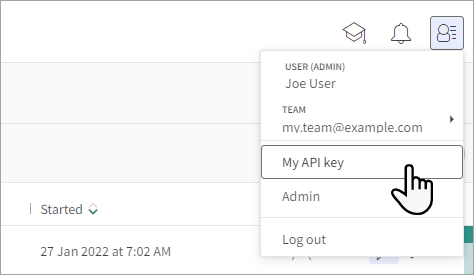
- Once logged in, click on your account name or avatar in the top-right corner.
- Select "My API key" from the dropdown menu.
- Copy the displayed API key.
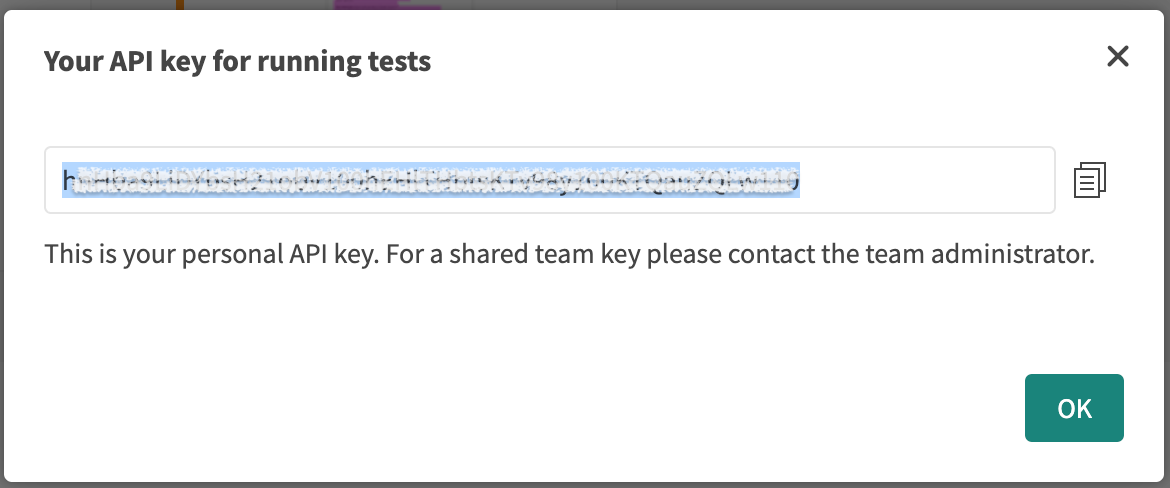
Use this API key in your project by setting it as an environment variable or entering it when prompted during the CLI setup.
export APPLITOOLS_API_KEY='your_api_key_here'
Recommended practice: It's advisable to set your API key as an environment variable APPLITOOLS_API_KEY instead of hardcoding it in your configuration file. This approach keeps your API key secure since configuration files are often checked into version control systems. However, rest assured that this API key only has EXECUTE permissions—it cannot be used to retrieve or modify test data or baselines. Its sole purpose is to authorize the execution of new tests within your account.
Navigating the dashboard interface
The Applitools Dashboard consists of several key components:
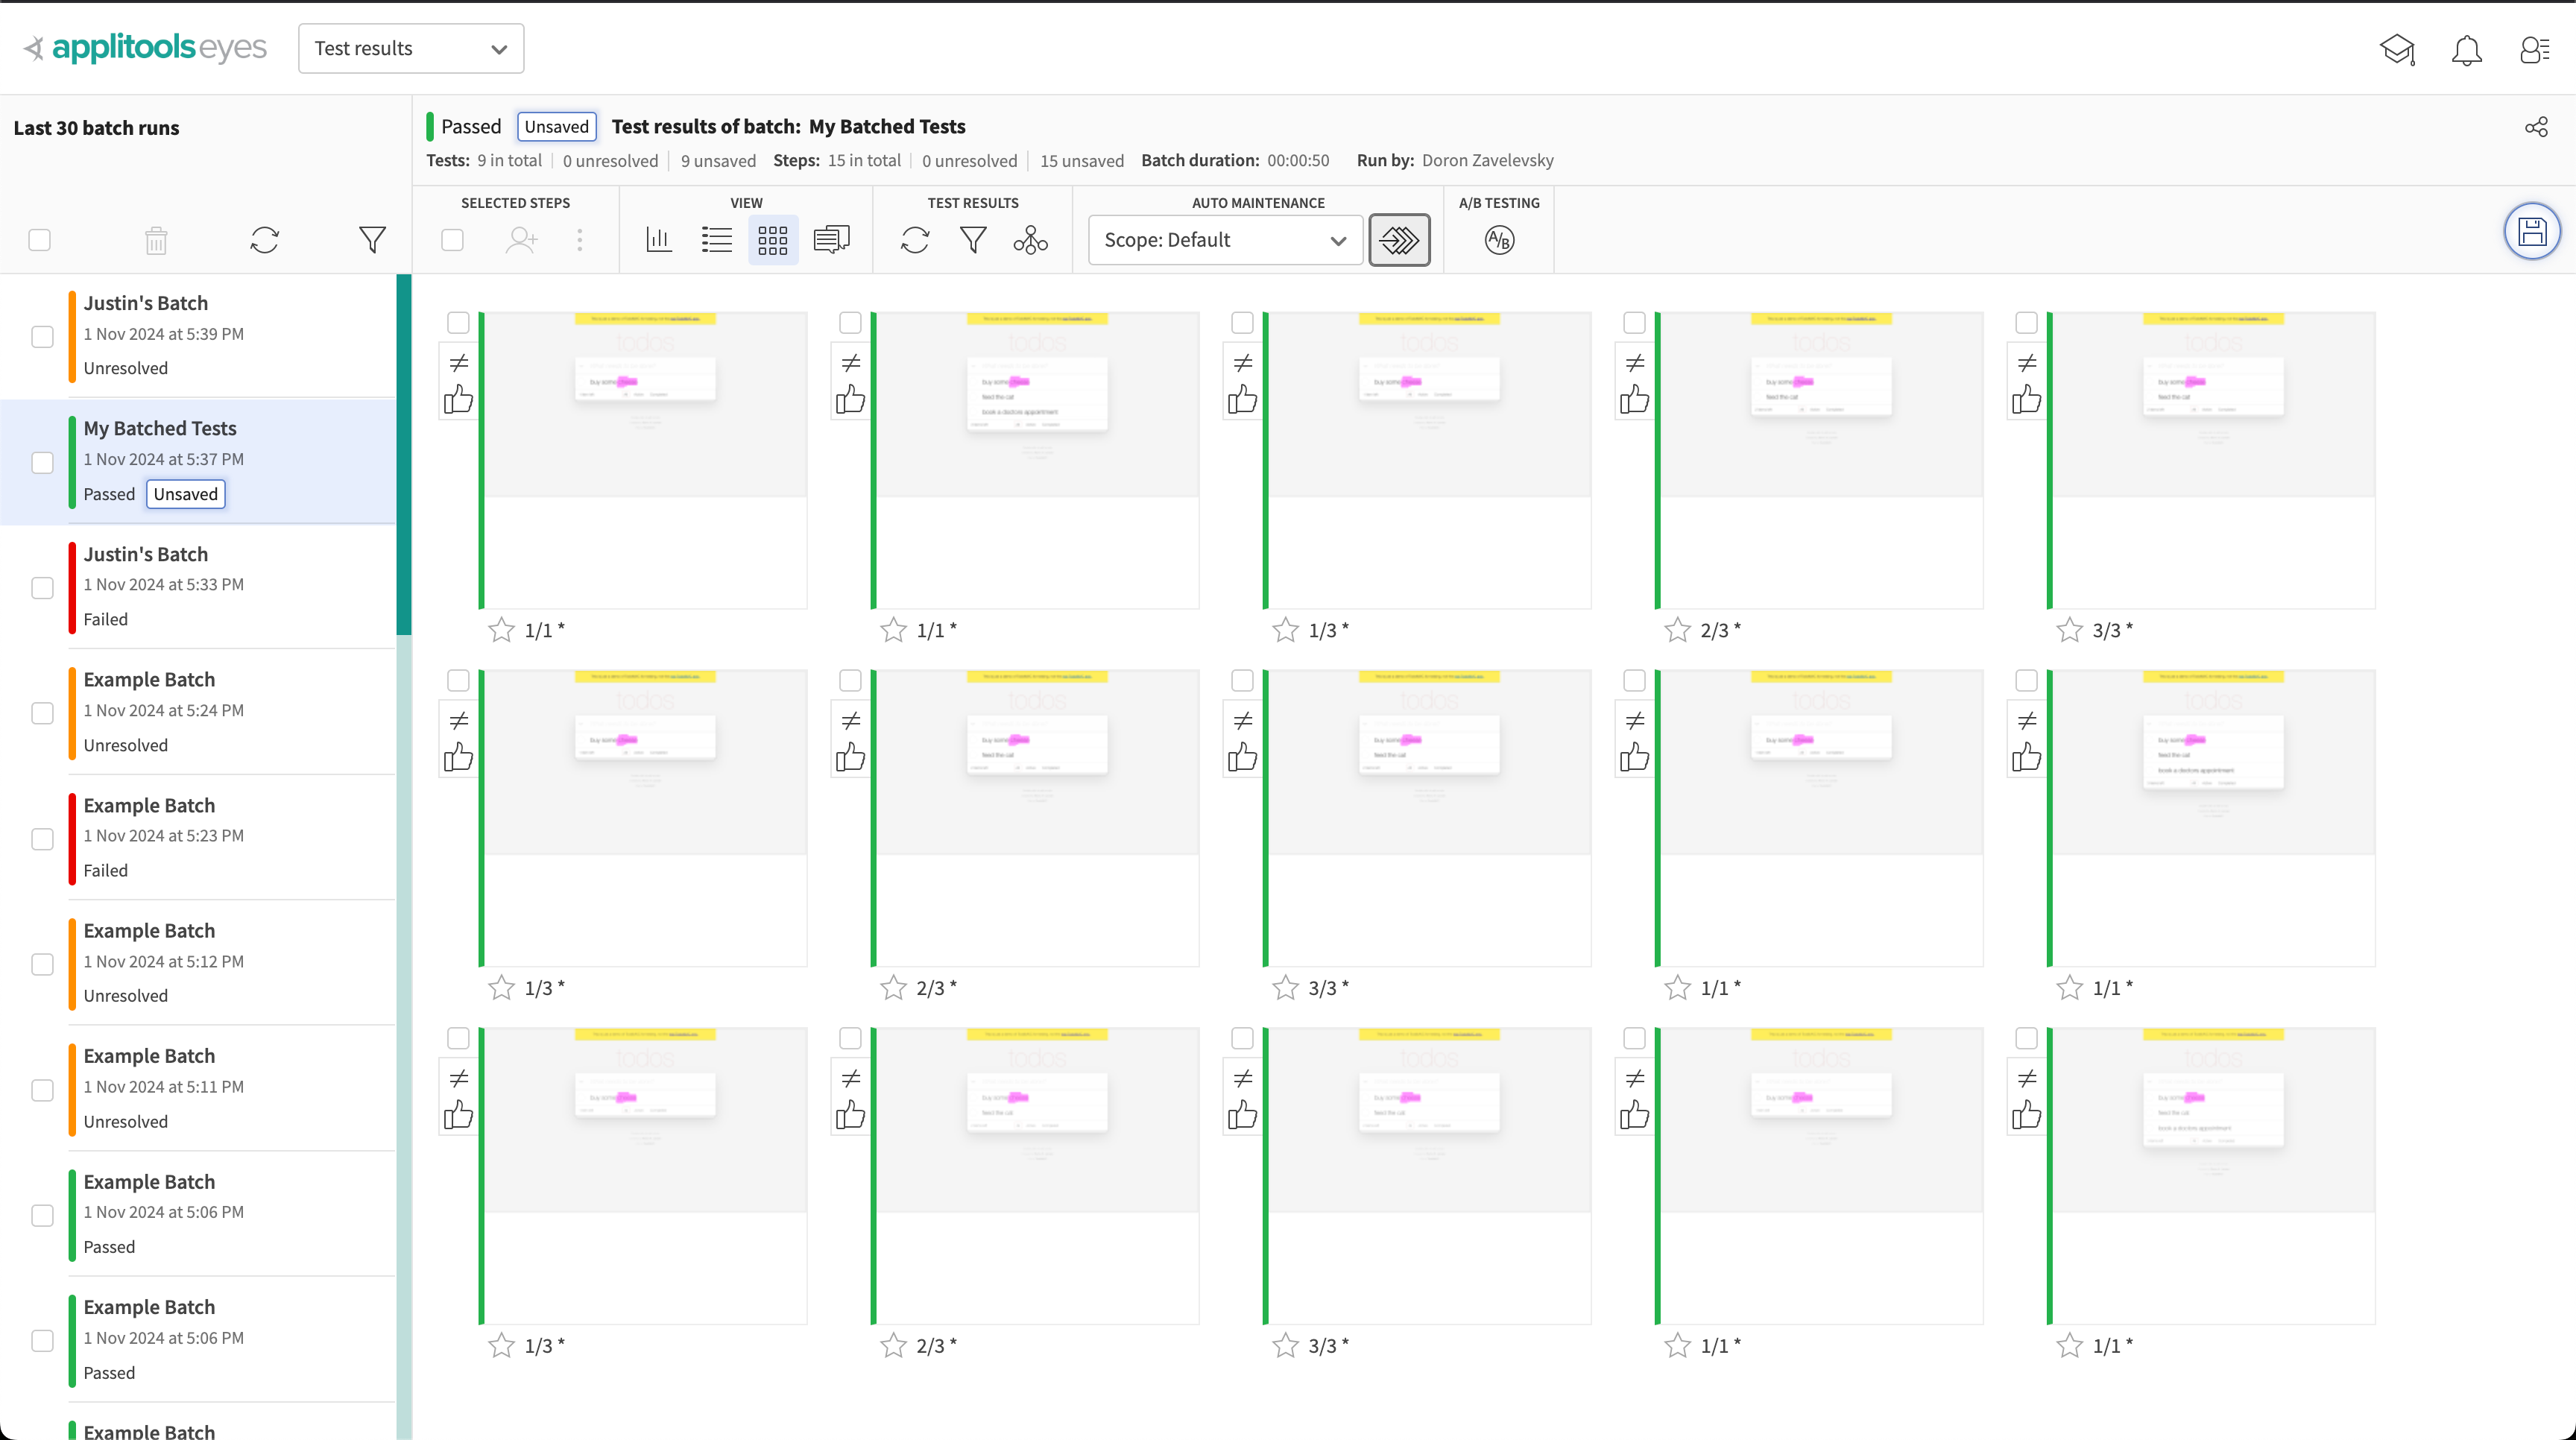
Test results page
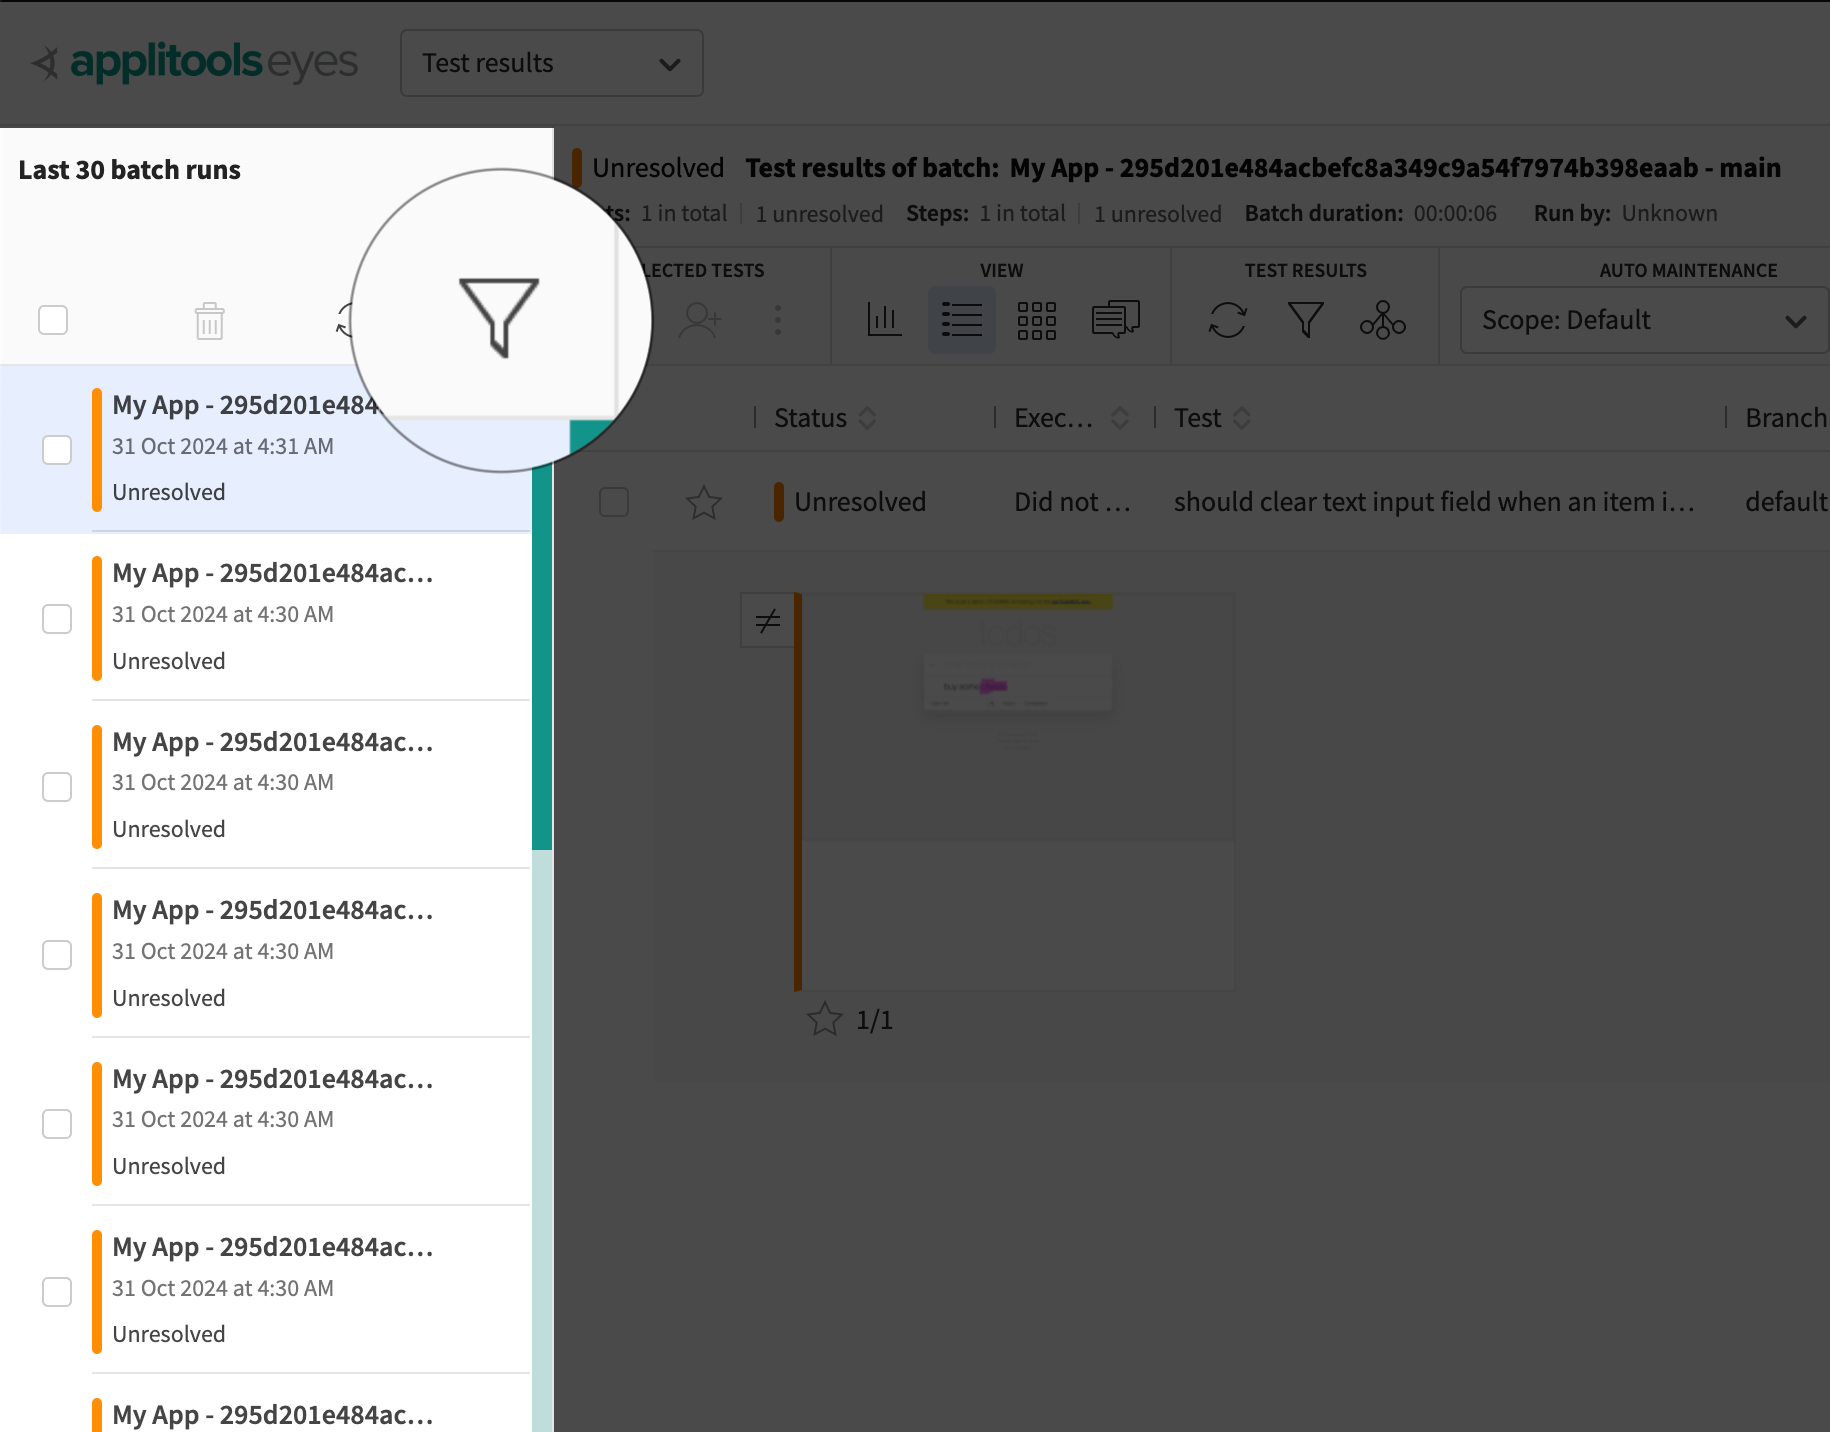
After logging in, you'll see the Test Results page, which lists all your recent test runs.
- Batch List: A list of test batches, grouped by batch name.
- Filter and Search: Tools to filter tests by date, application name, batch name, or status.
Batch details
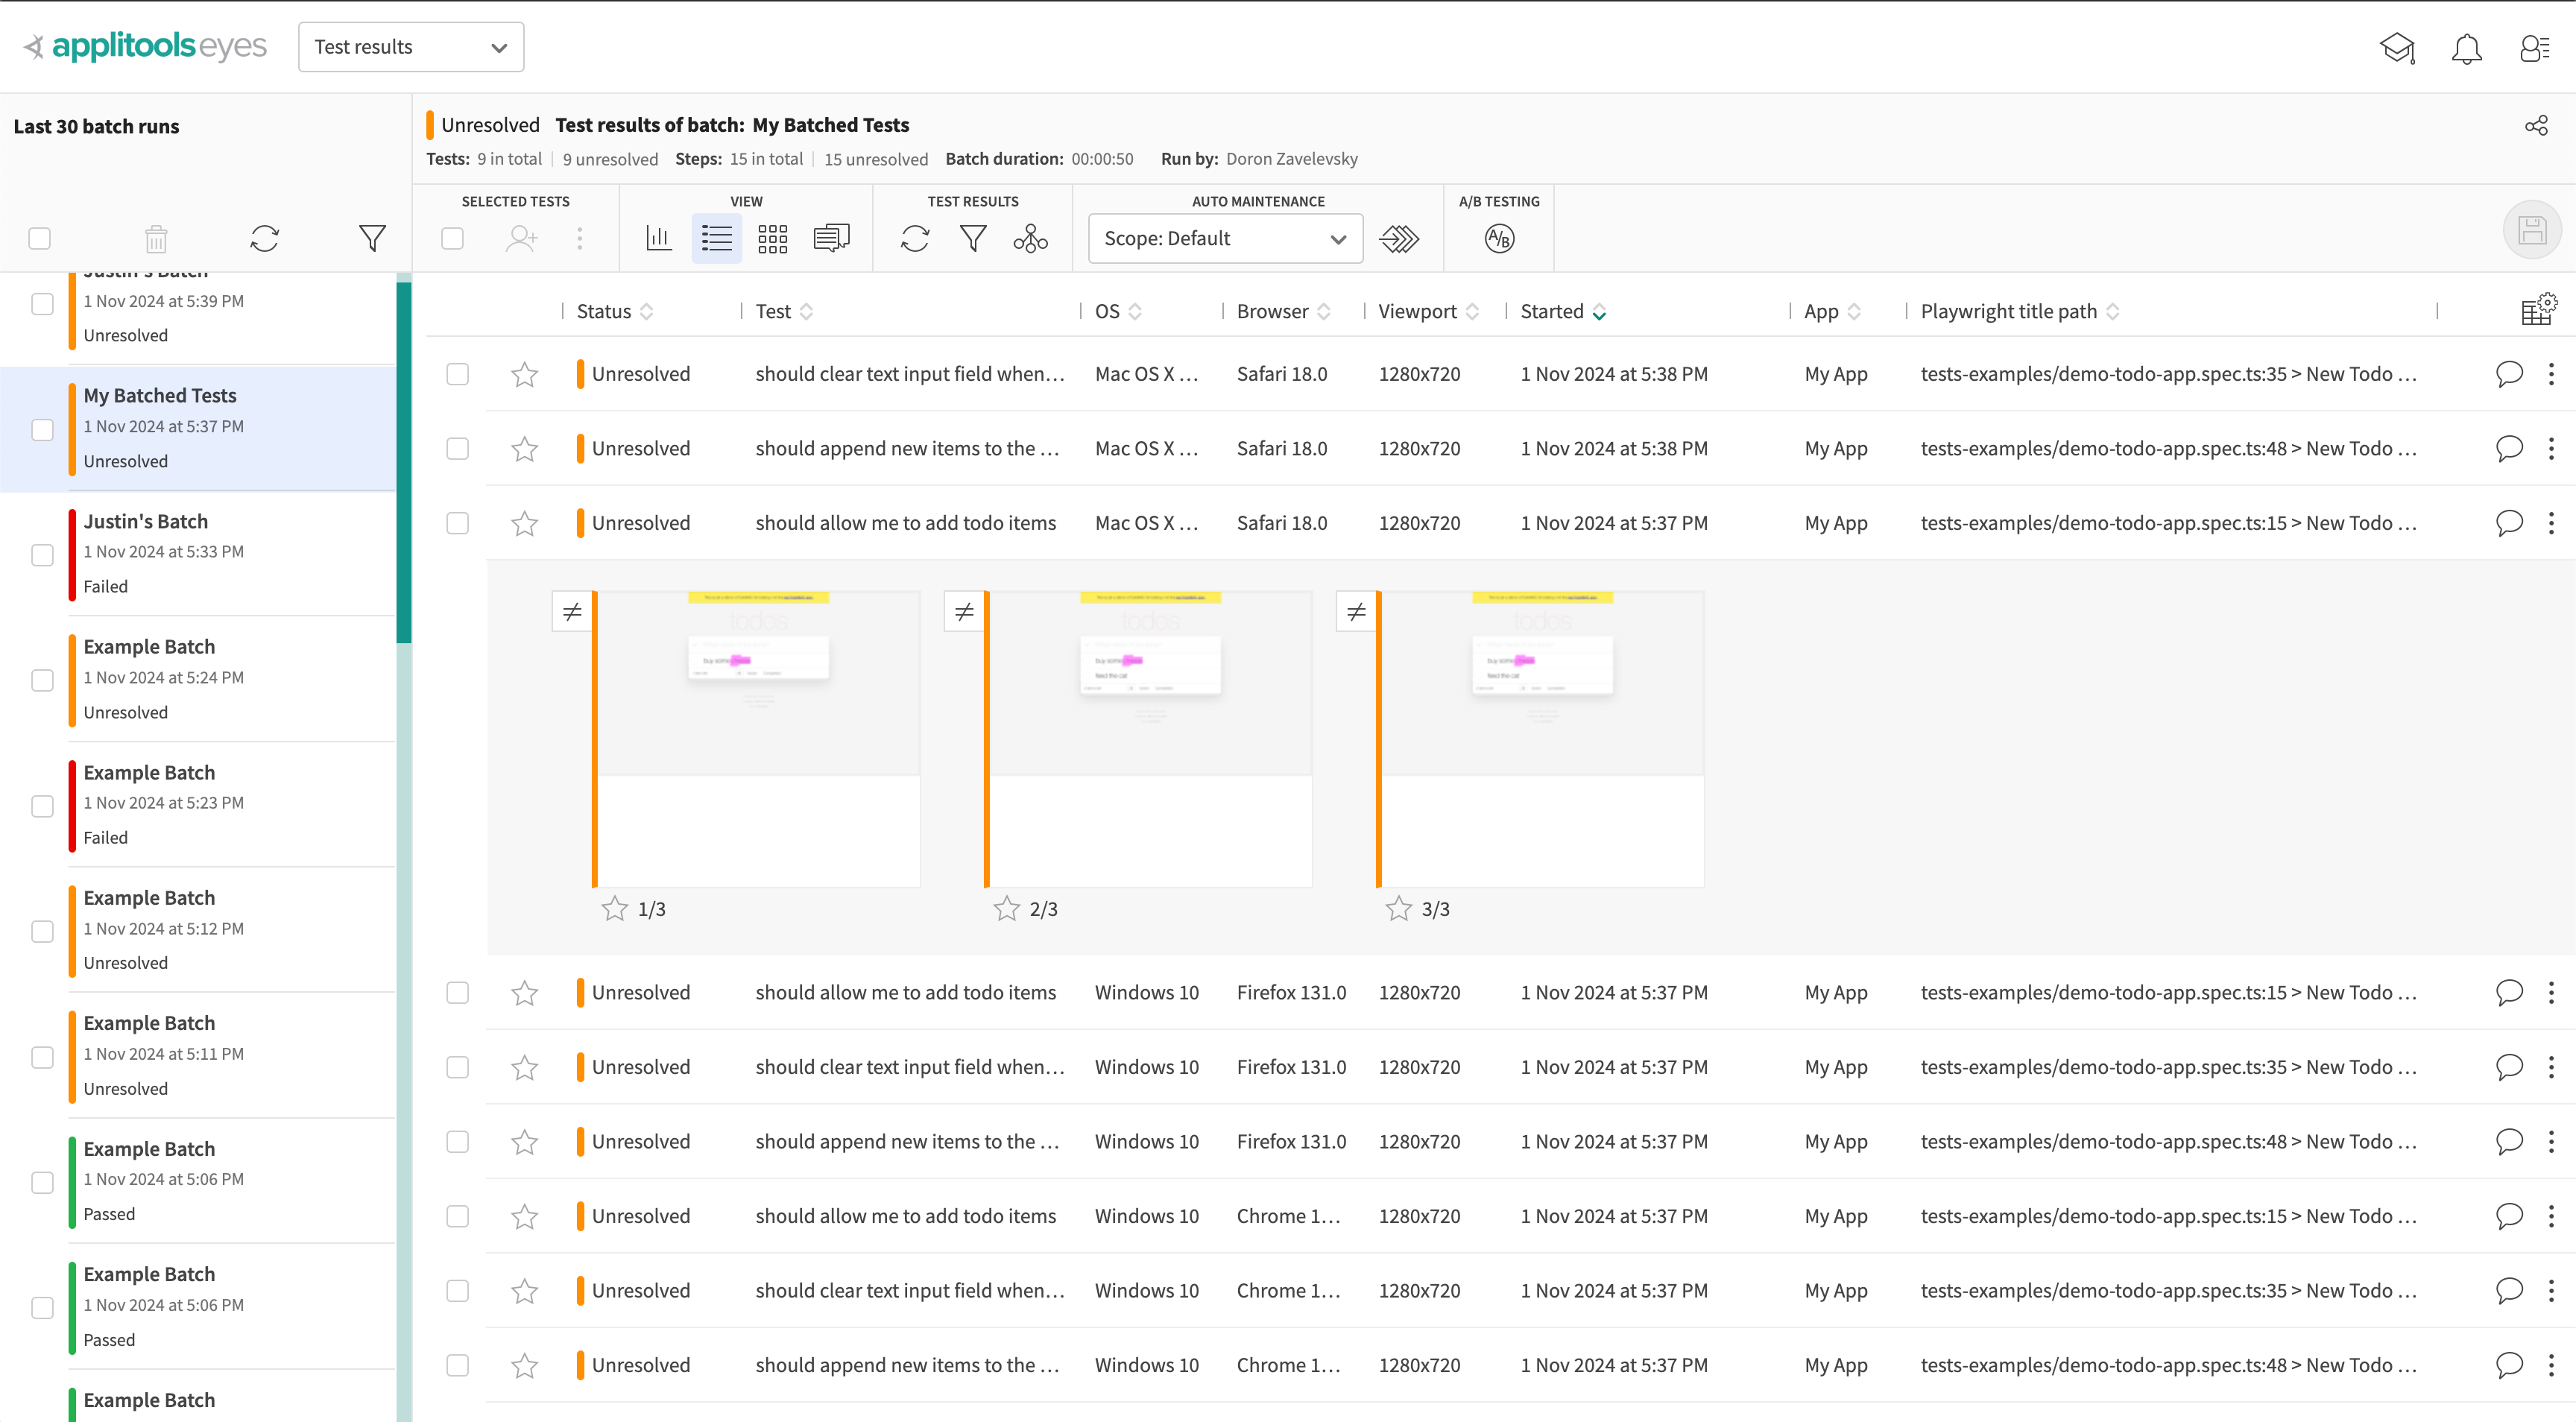
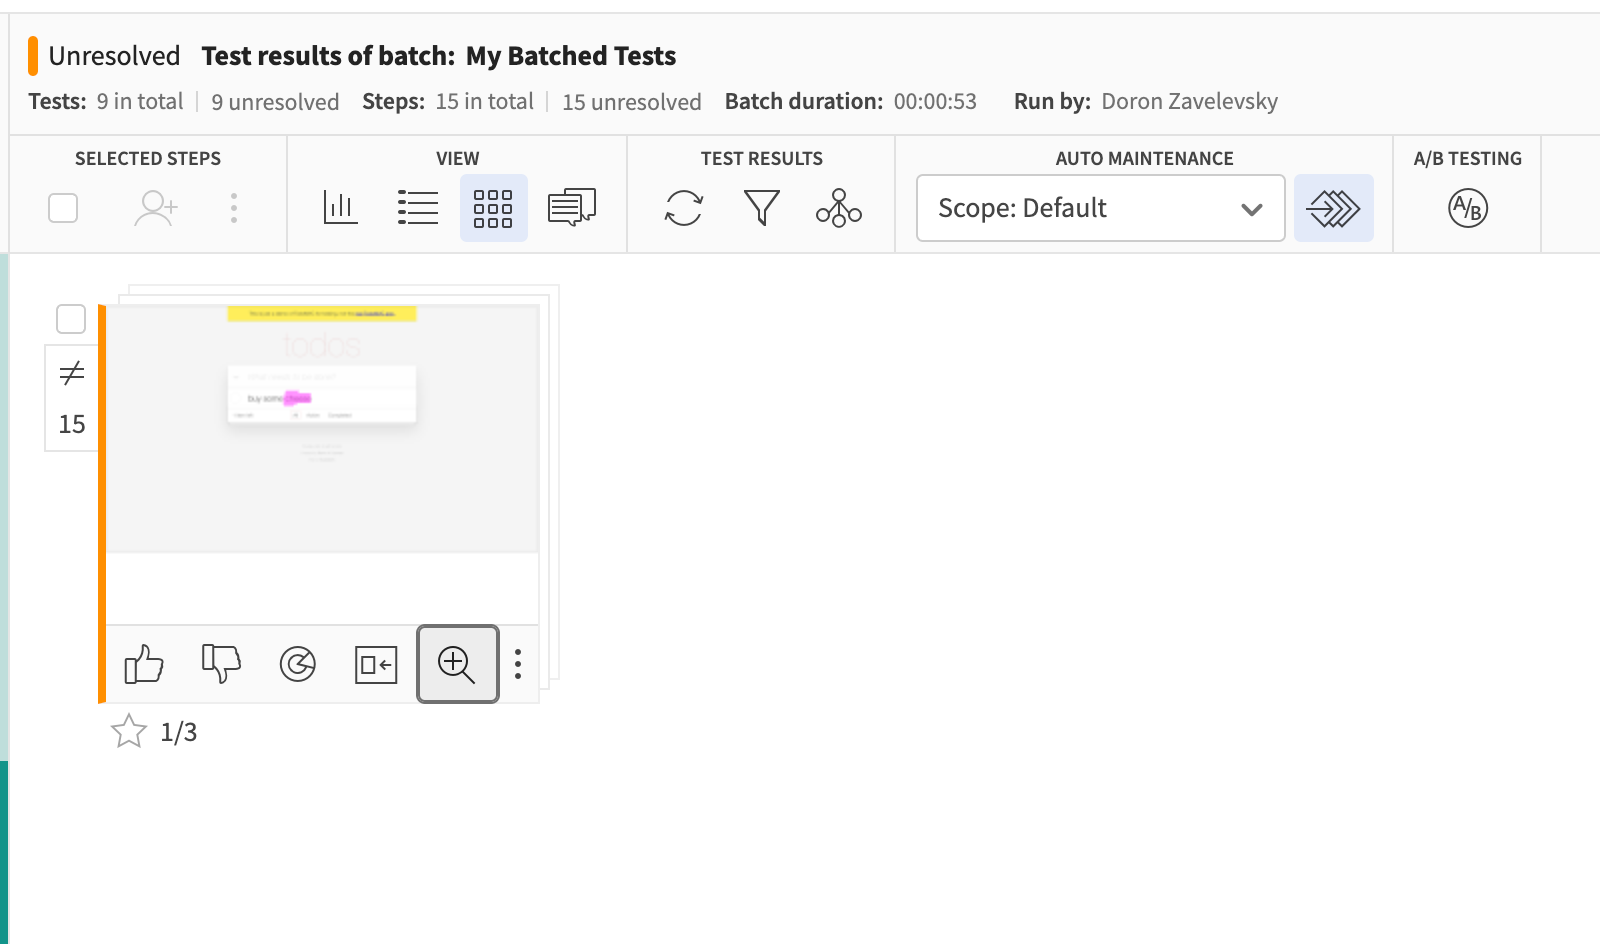
Clicking on a batch opens the Batch Details view, showing individual tests within that batch.
- Test List: A list of tests with their statuses (Passed, Unresolved, Failed).
- Batch Information: Details like batch name, start time, and duration.
Test details and steps
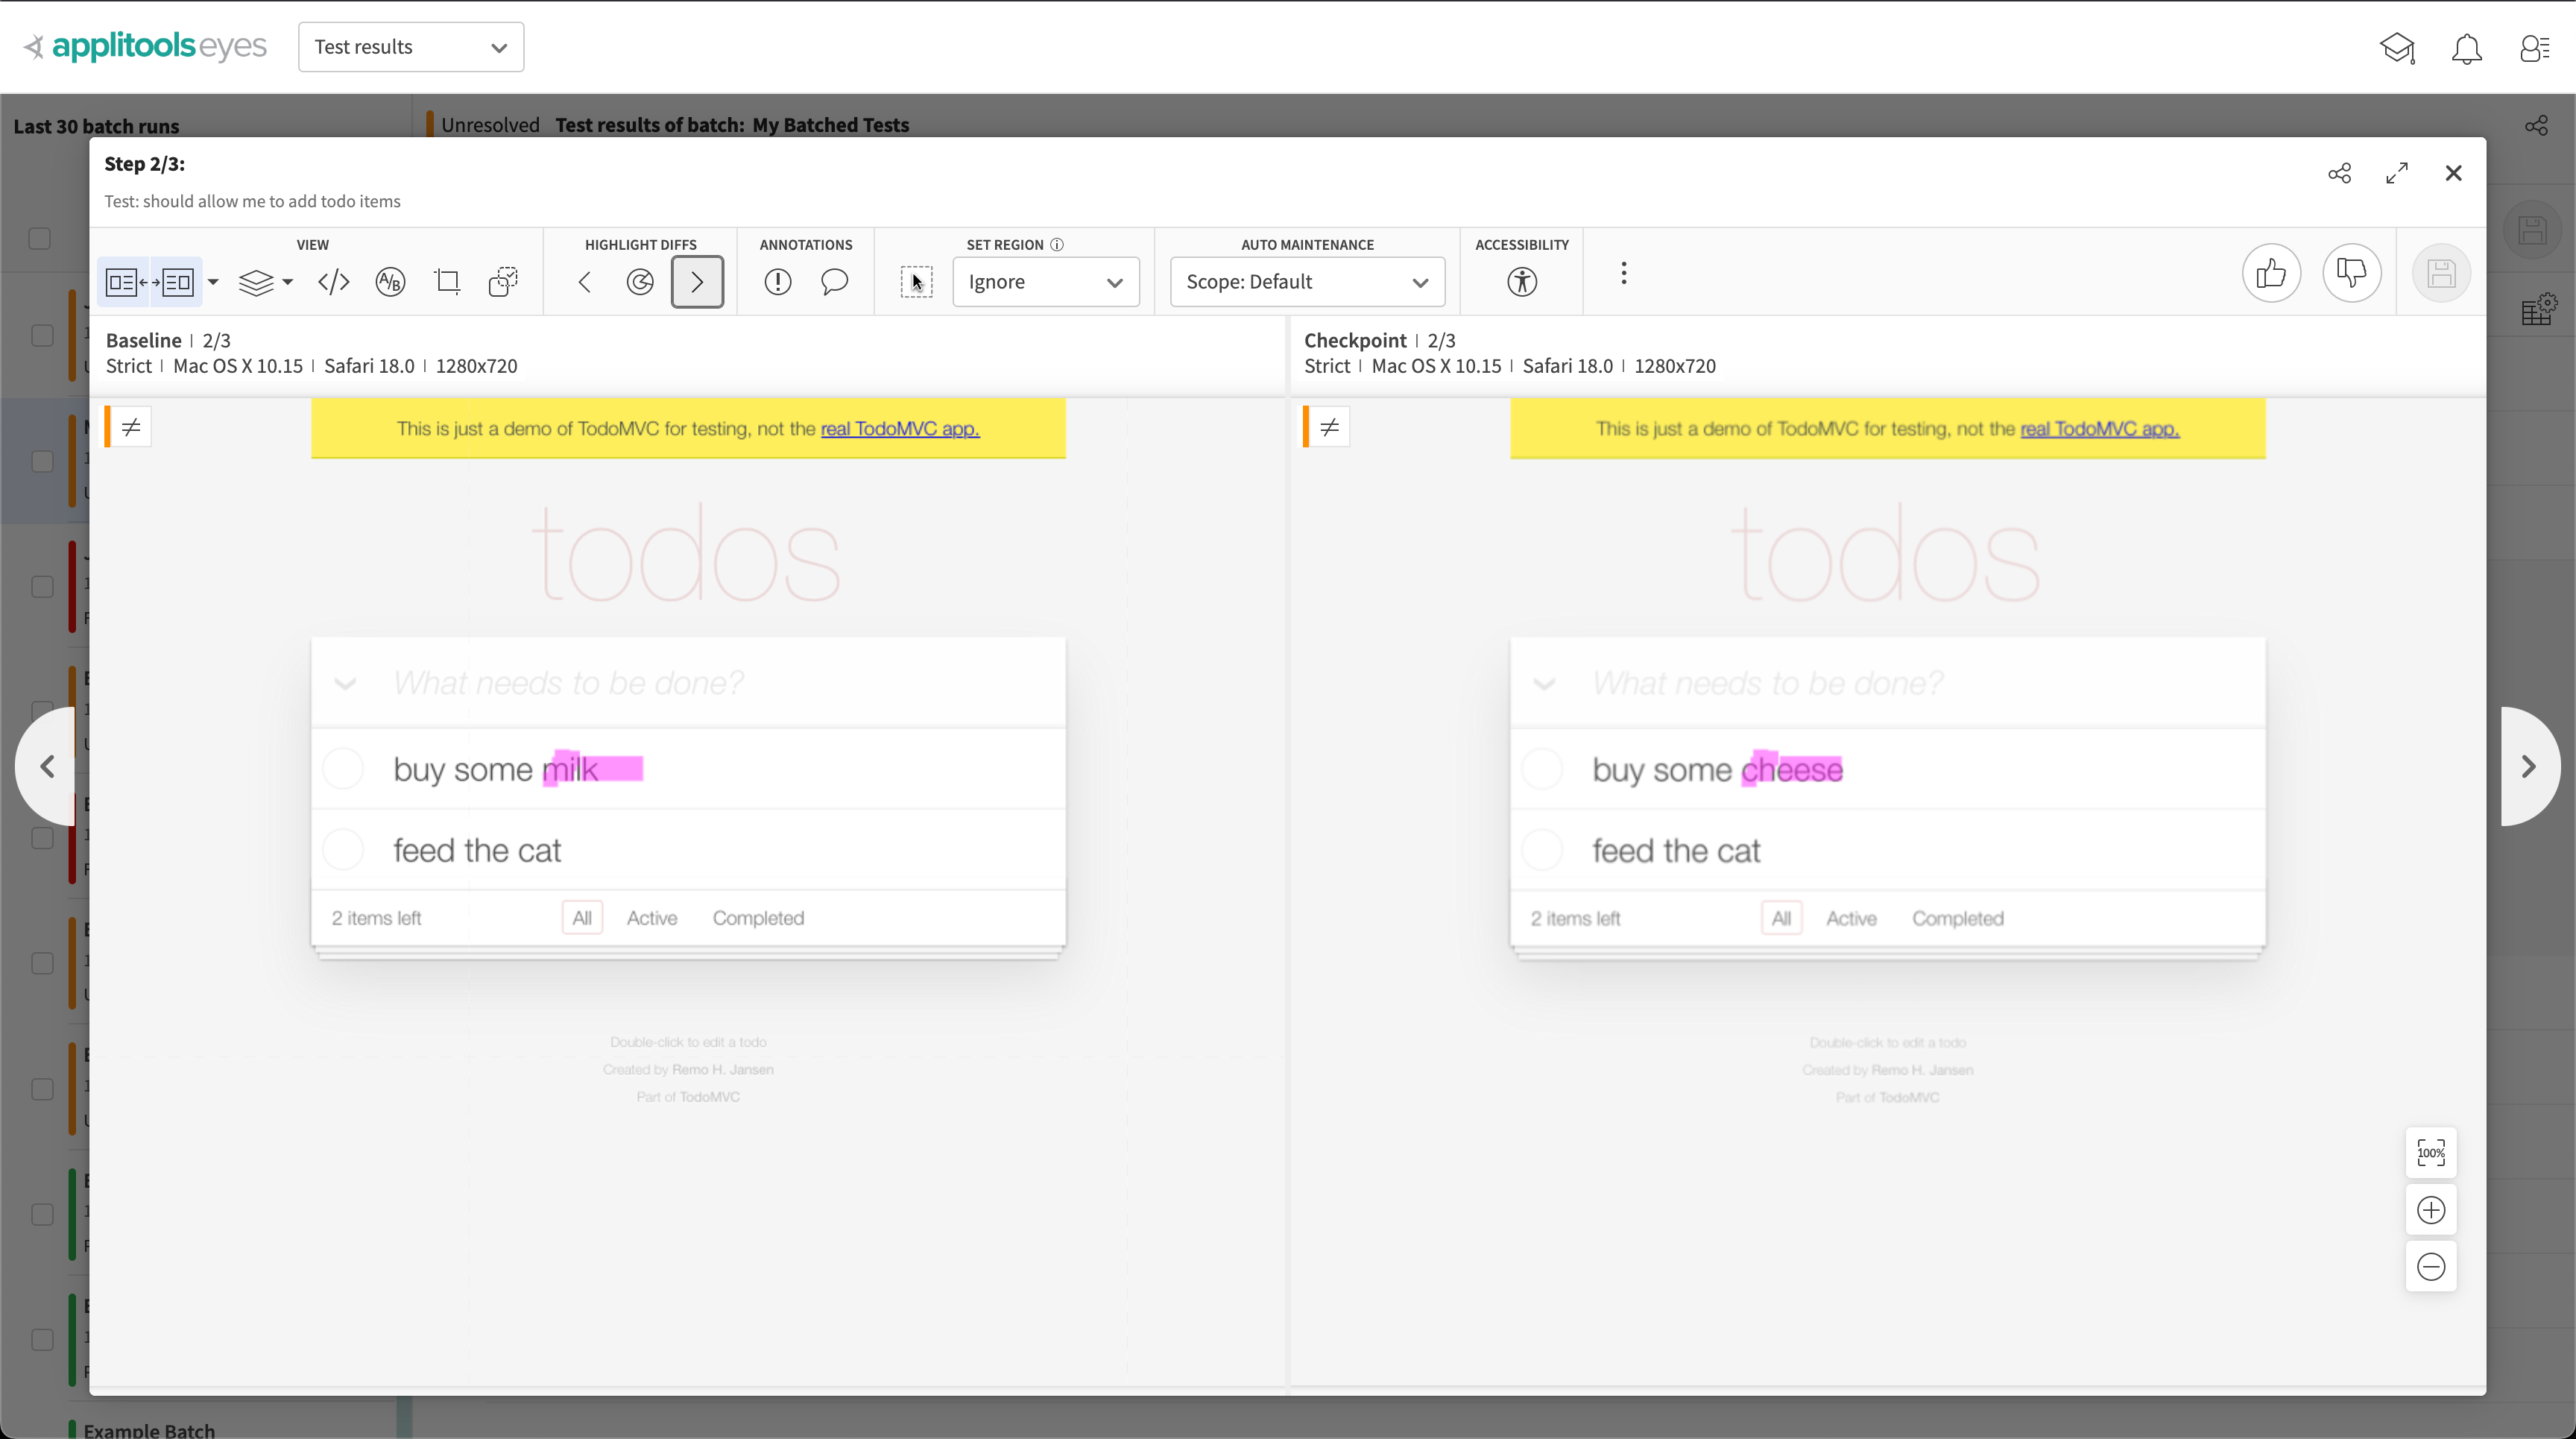
Selecting a test displays the Test Details, where you can view each step and its comparison results.
- Step List: Screenshots captured at each visual checkpoint.
- Baseline and Checkpoint Images: Side-by-side comparison of the baseline and the new screenshot.
- Differences Overlay: Highlighted areas where visual differences were detected.
Analyzing test results and visual differences
Viewing visual diffs
For steps with visual differences:
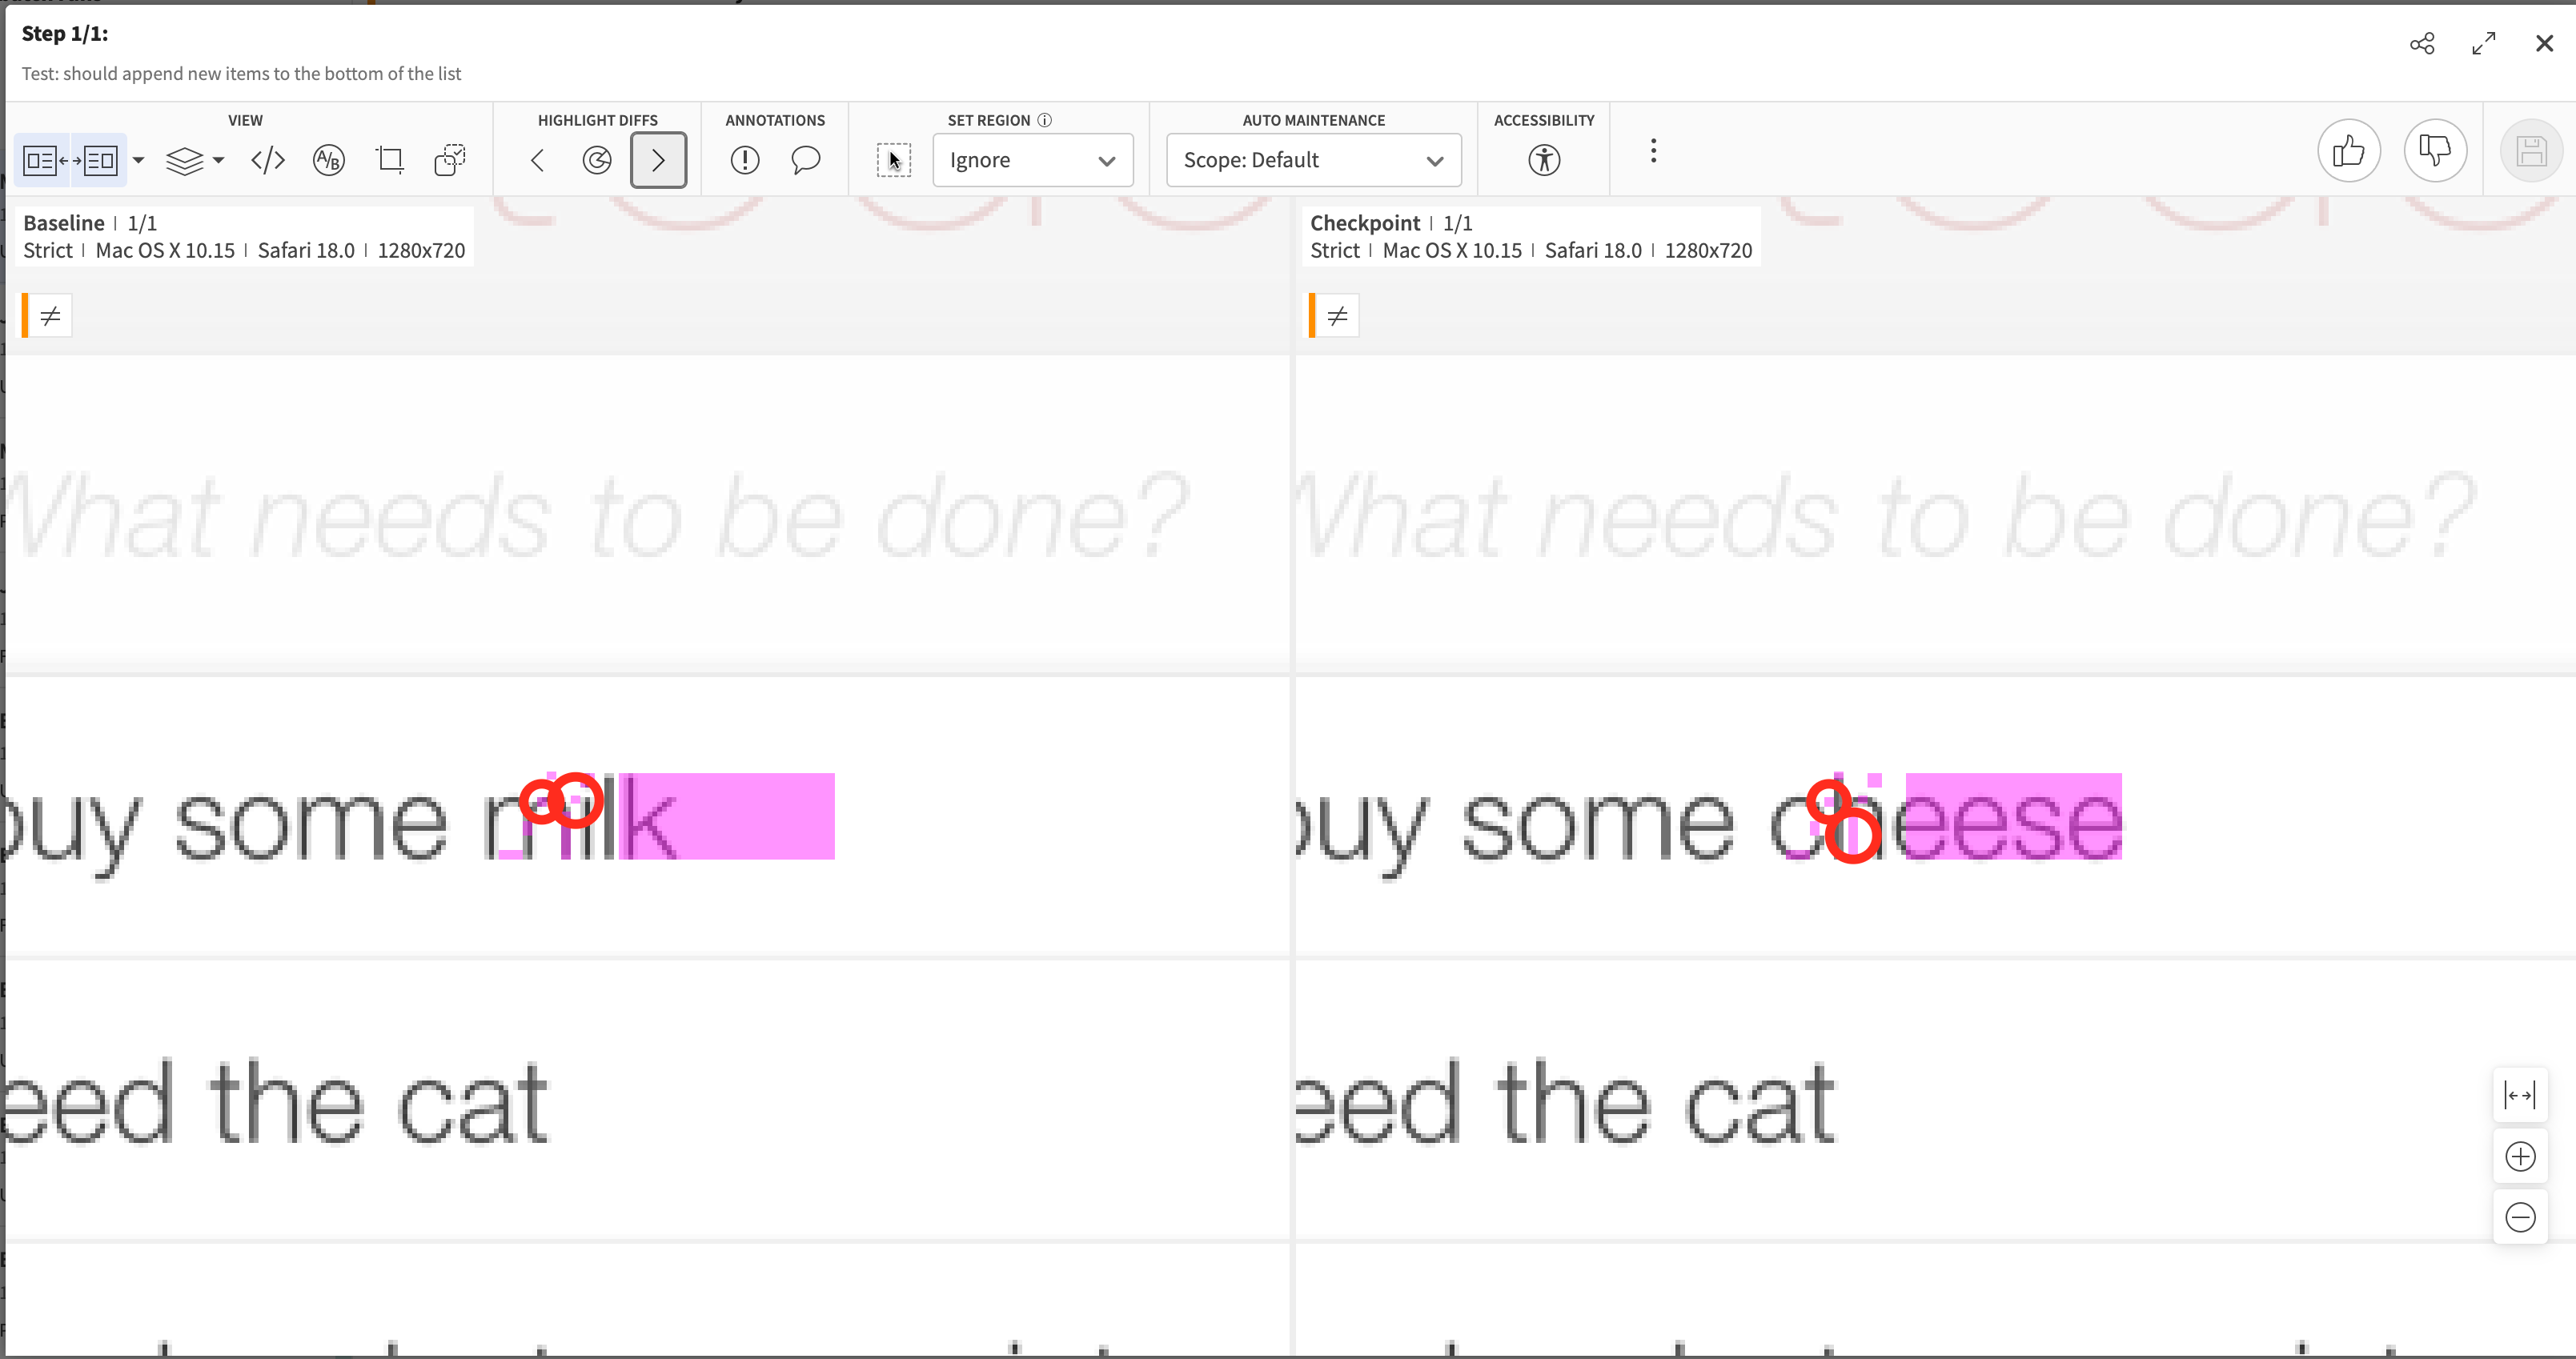
- Click on the step to open the comparison view.
- Use the toolbar to switch between different comparison modes:
- Side-by-Side: Displays baseline and checkpoint images next to each other.
- Toggle: Quickly switch between images to spot changes.
Interpreting differences
- Highlighted Areas: Differences are marked with colored overlays.
- Ignore Regions: Areas you specified to ignore are indicated.
Root cause analysis
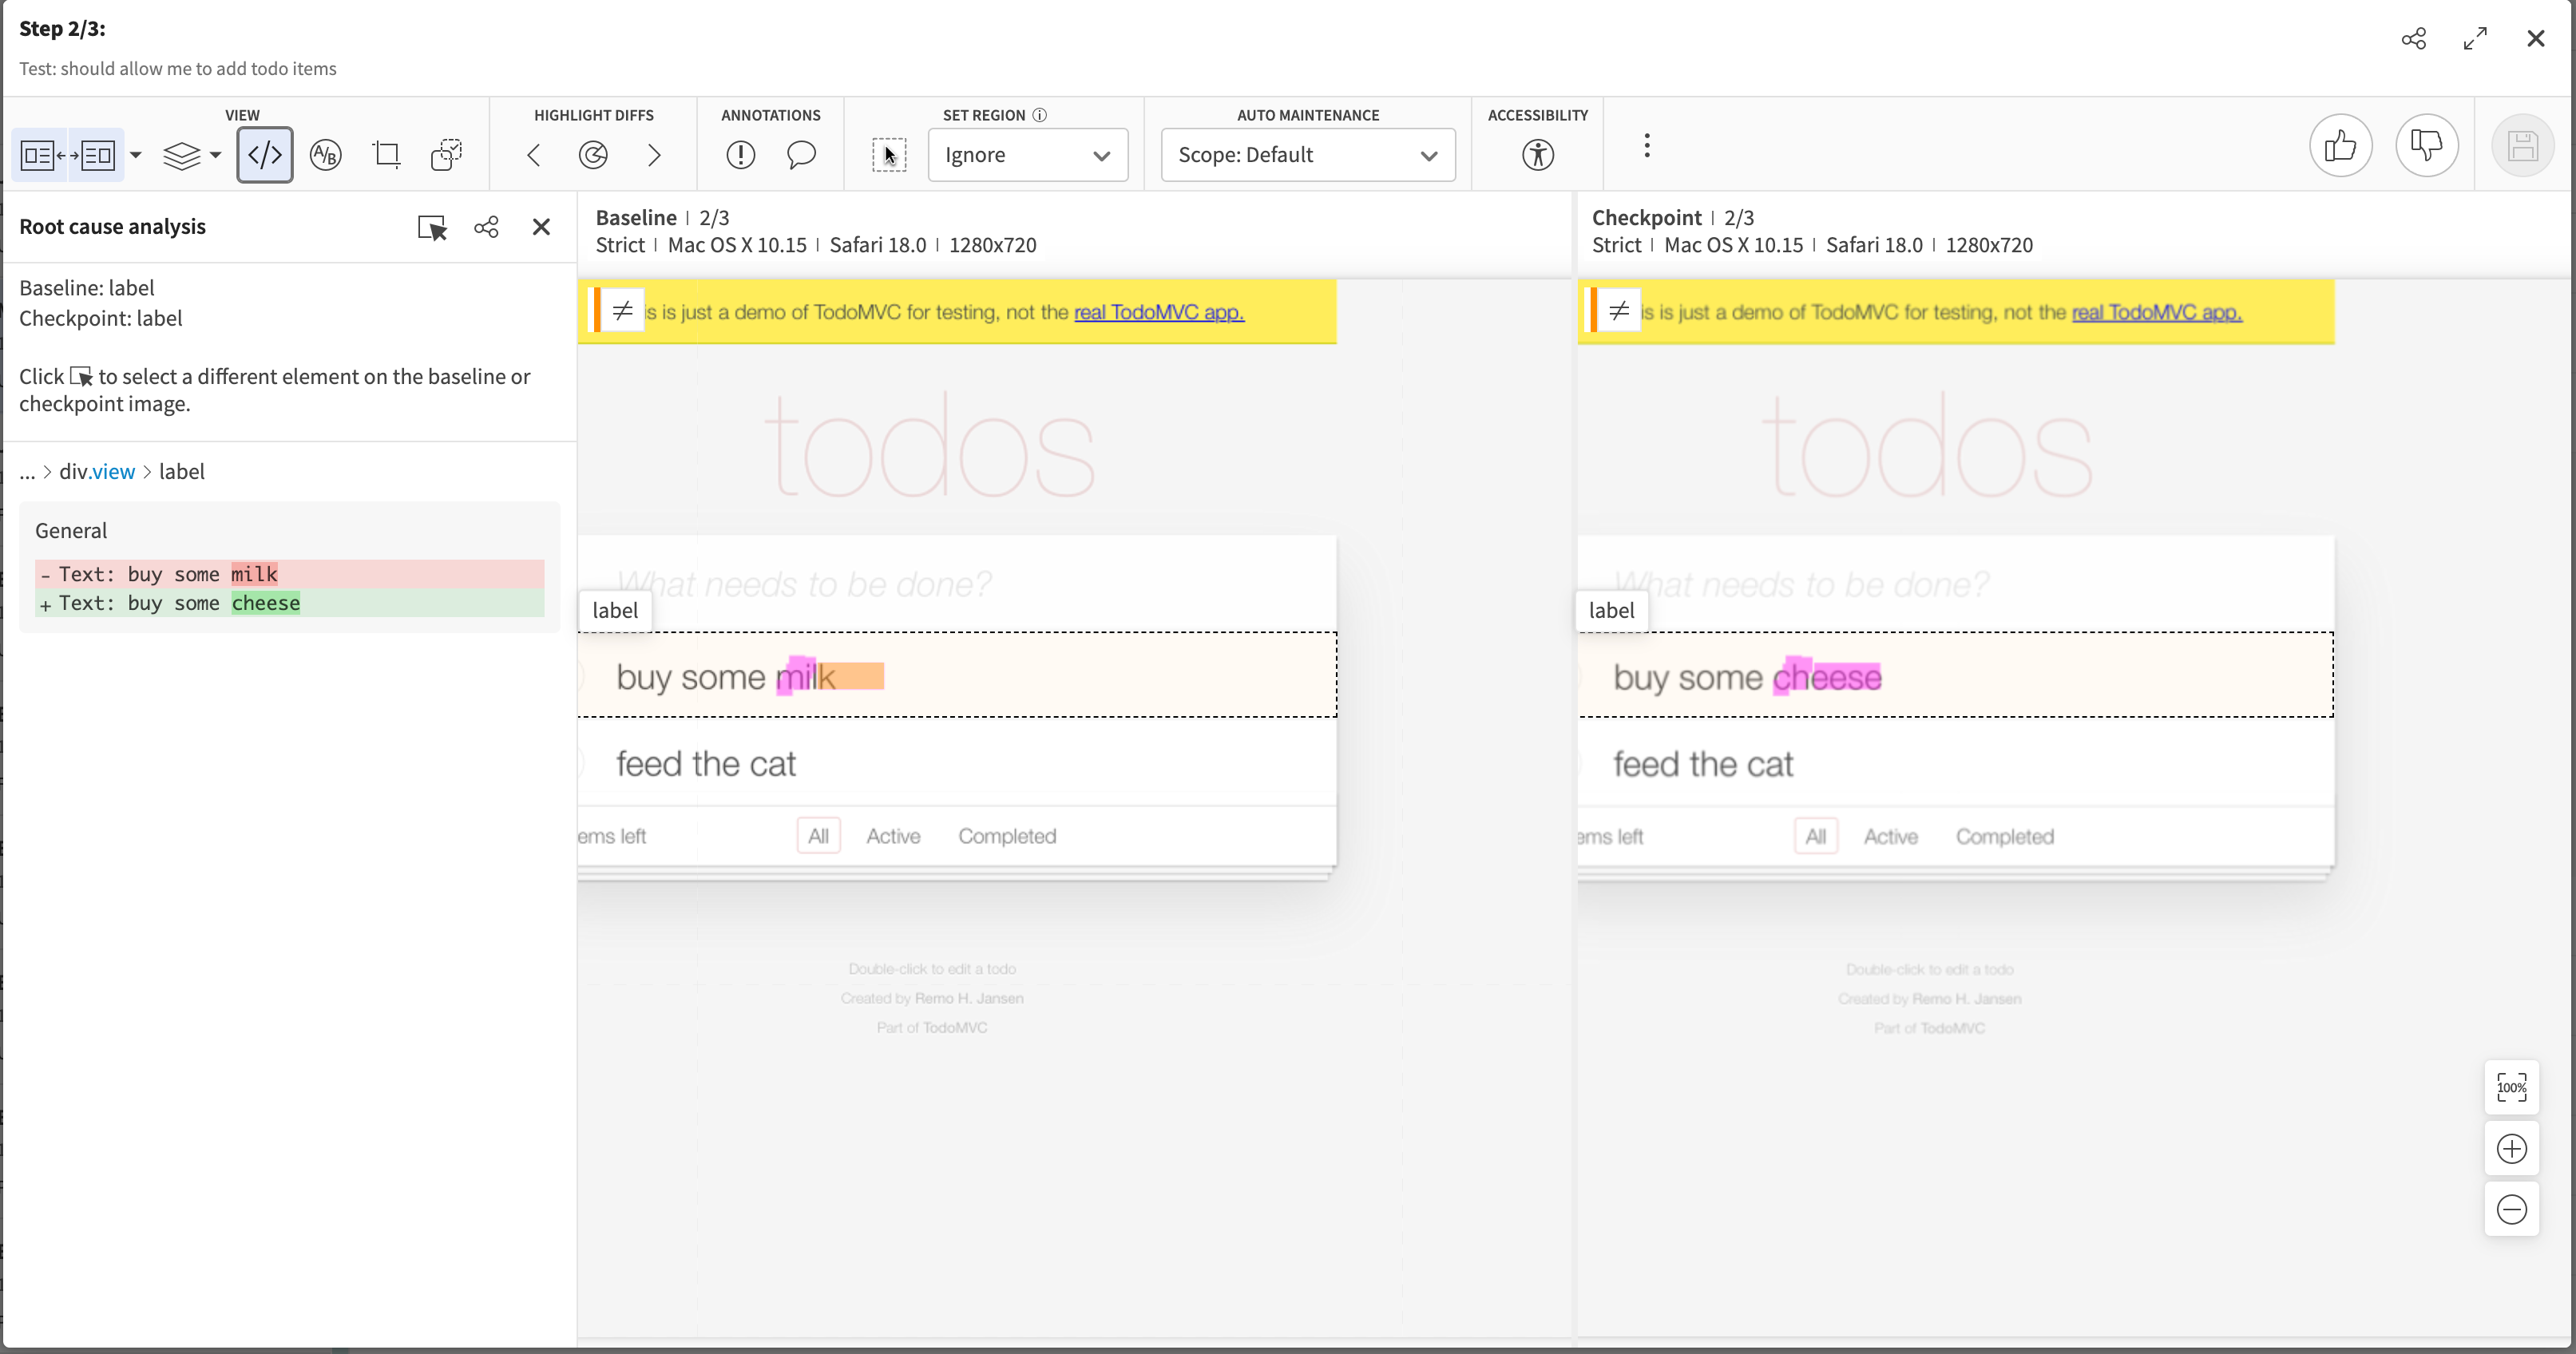
For advanced debugging, use the Root Cause Analysis feature:
- Click on the "Root Cause" button (represented by a brackets icon).
- View differences in the underlying DOM and CSS.
- Identify specific code changes that led to visual differences.
Managing baselines and approving changes
Accepting or rejecting changes
For each test step with differences:
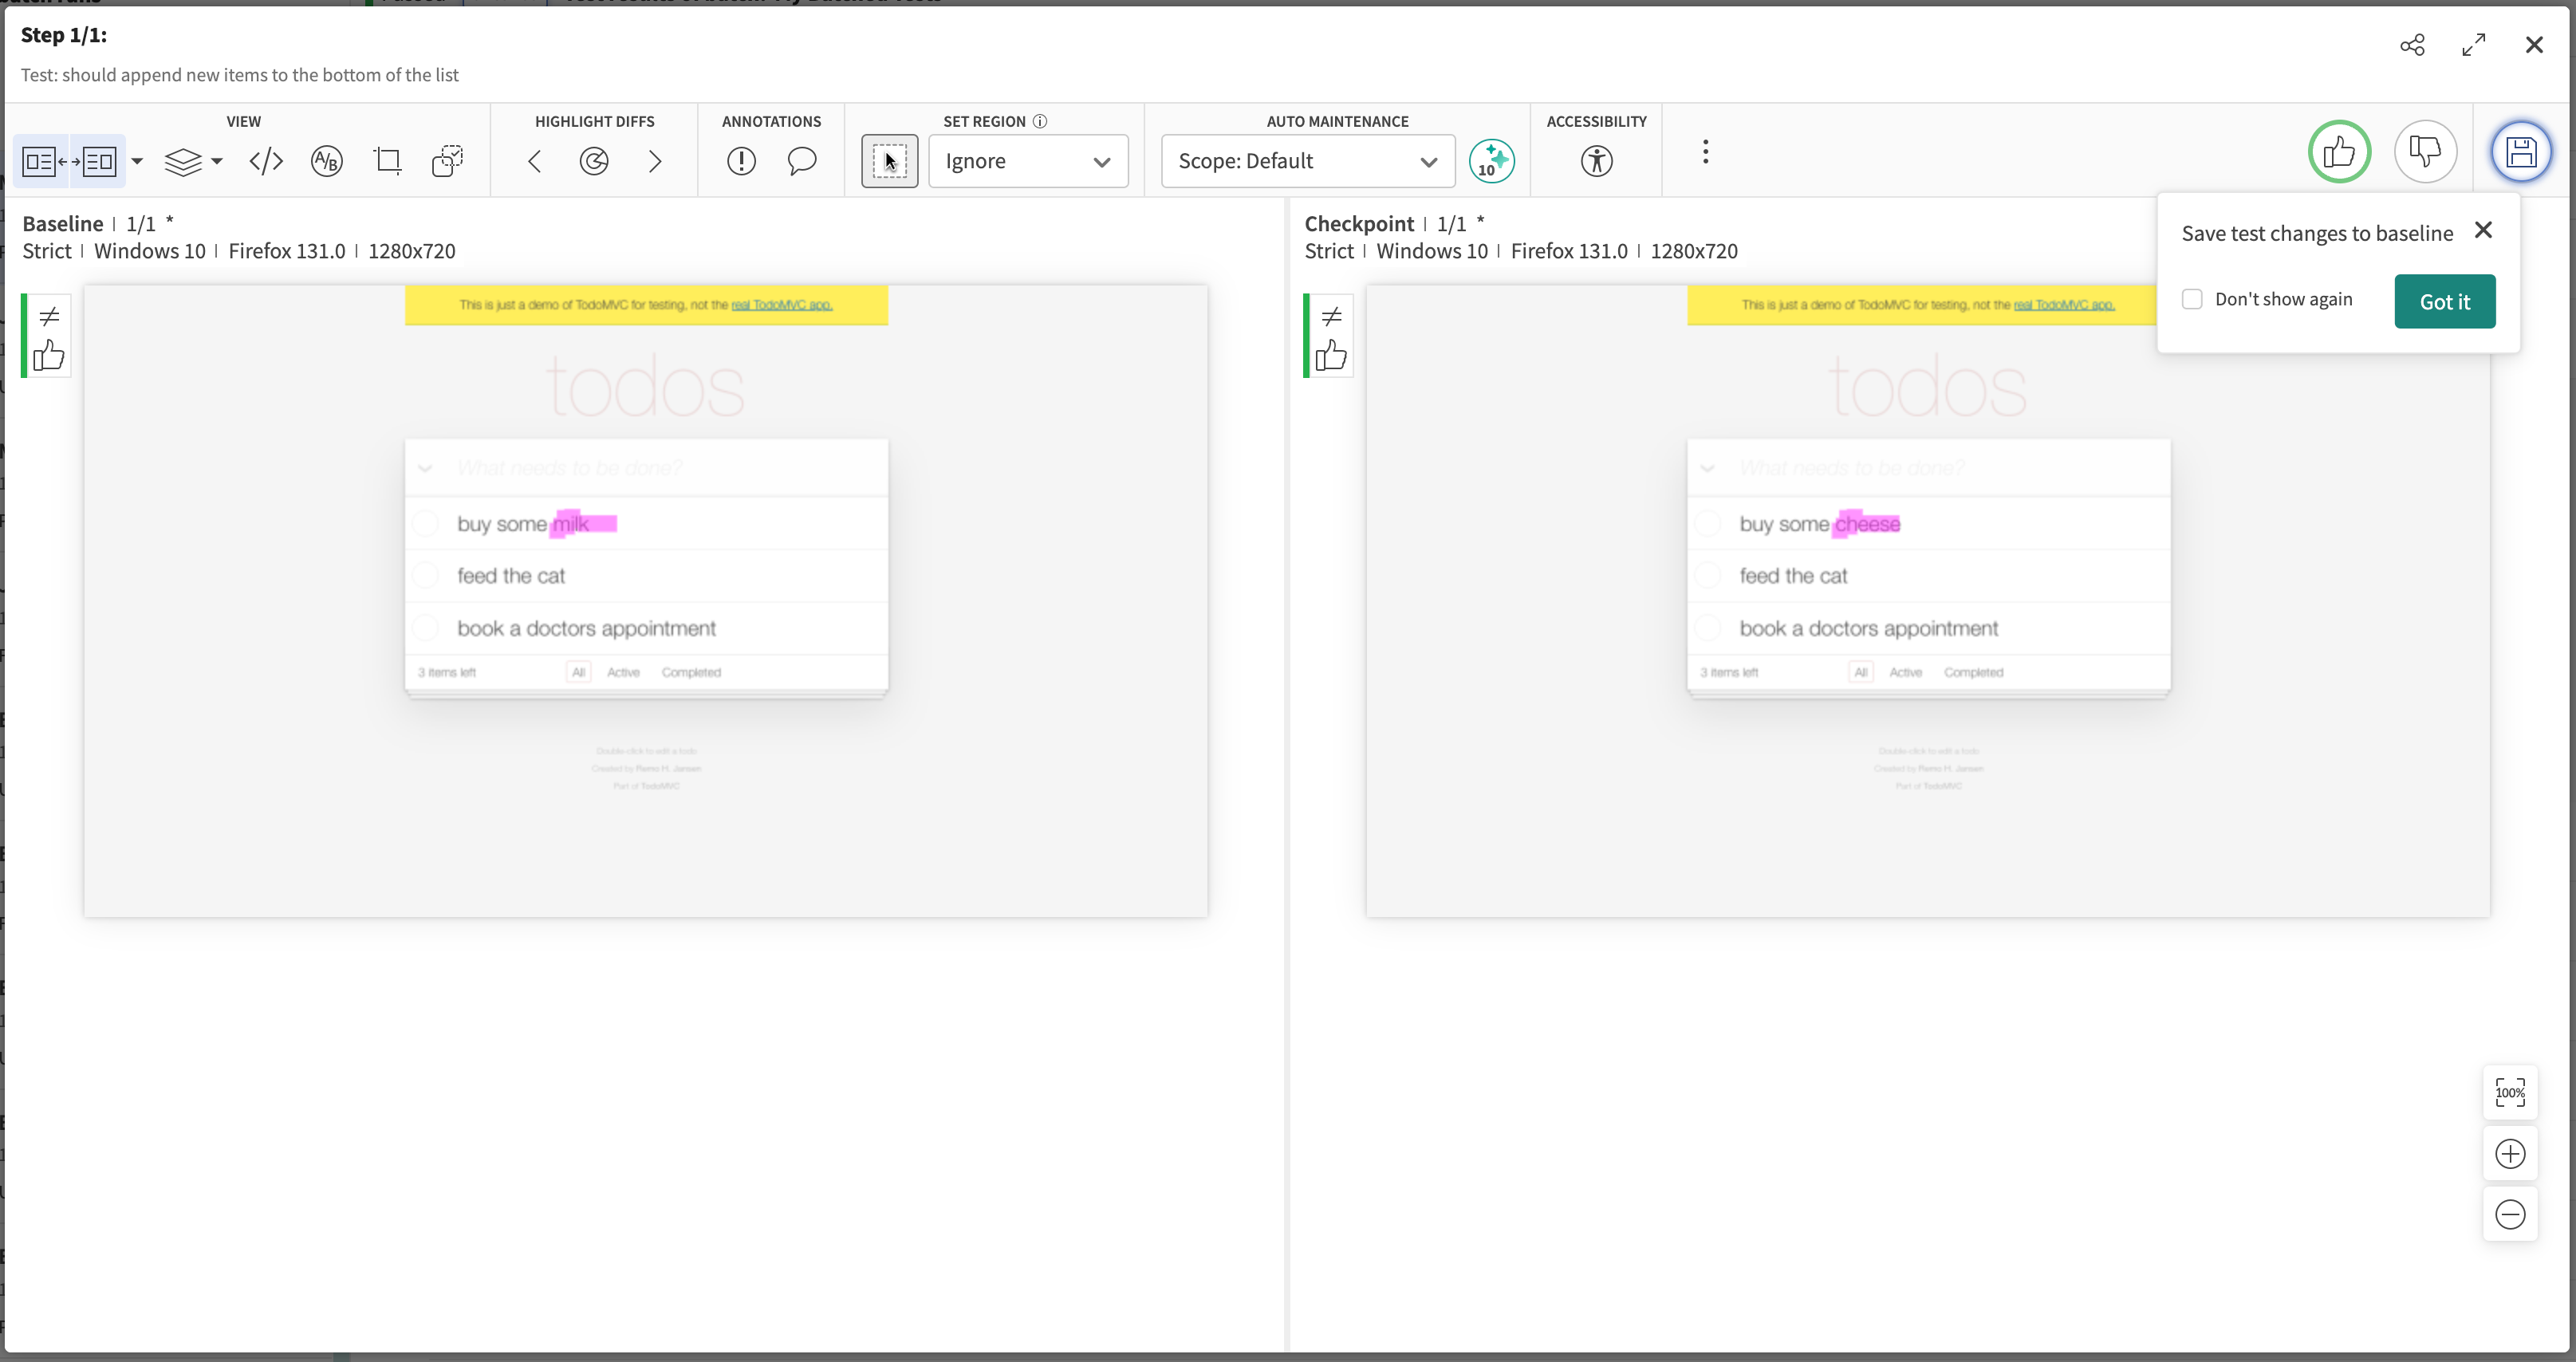
- Accept (Approve): Confirms the changes are intentional, updating the baseline.
- Reject: Marks the differences as unintended, indicating a potential bug.
How to accept changes:
- Click the "Thumbs Up" icon to accept the changes.
- Optionally, add a remark explaining the acceptance.
How to reject changes:
- Click the "Thumbs Down" icon to reject the changes.
- Optionally, add a bug detailing the issue.
Saving decisions
After reviewing all differences:
- Click on the "Save" button to apply your decisions.
- The baseline images will be updated accordingly for future test runs.
Collaborating with your team
Sharing test results
- Direct Links: Share URLs to specific tests or steps with team members.
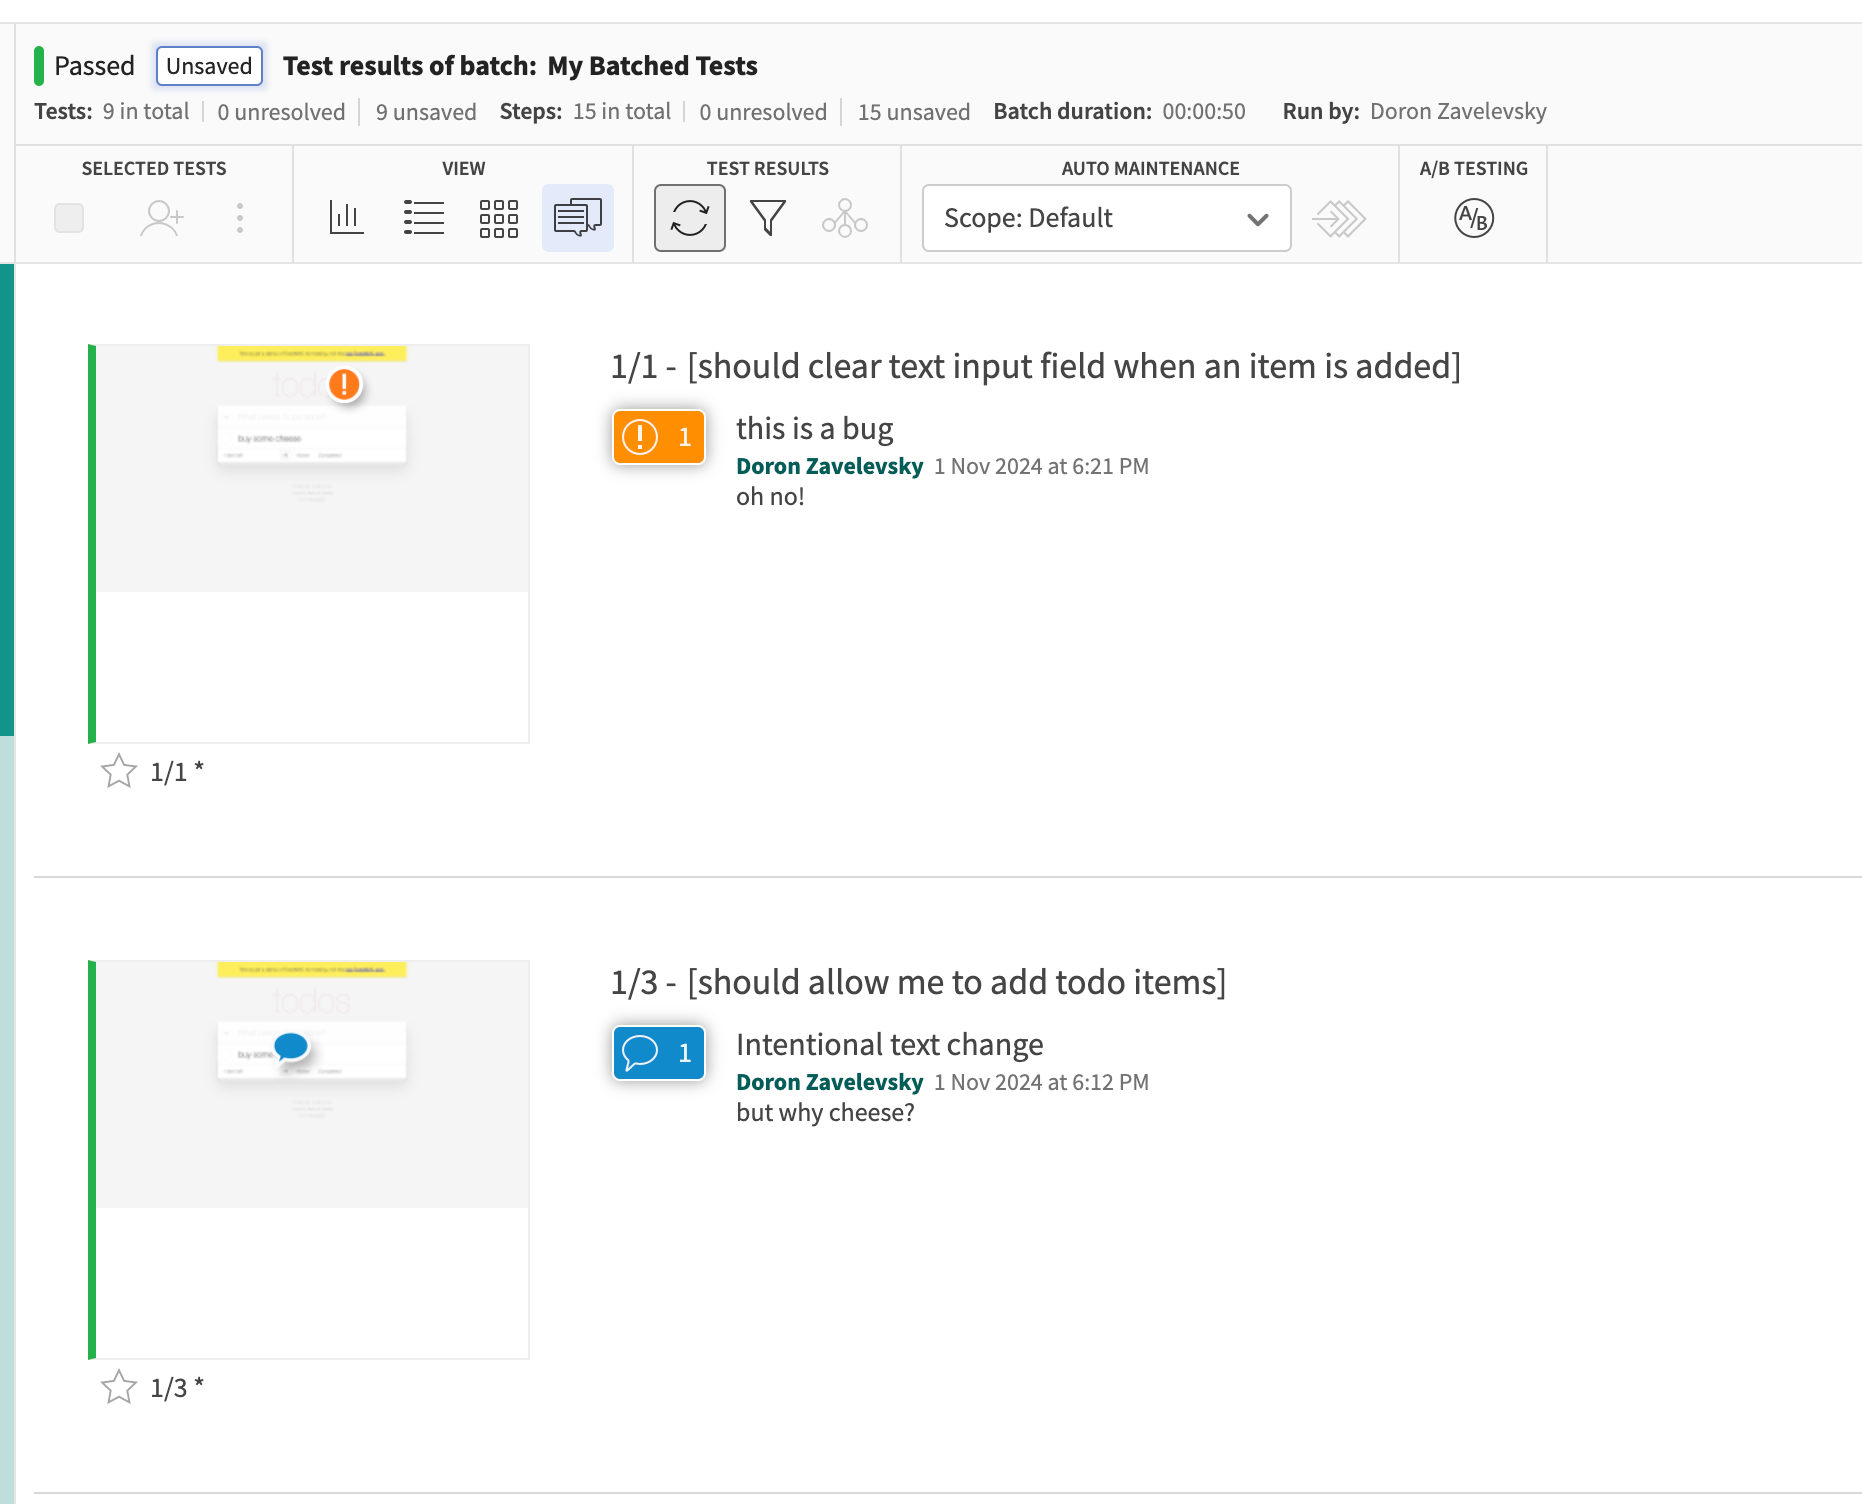
Adding remarks and bugs
- Remarks: Add remarks on specific steps or differences to communicate with your team.
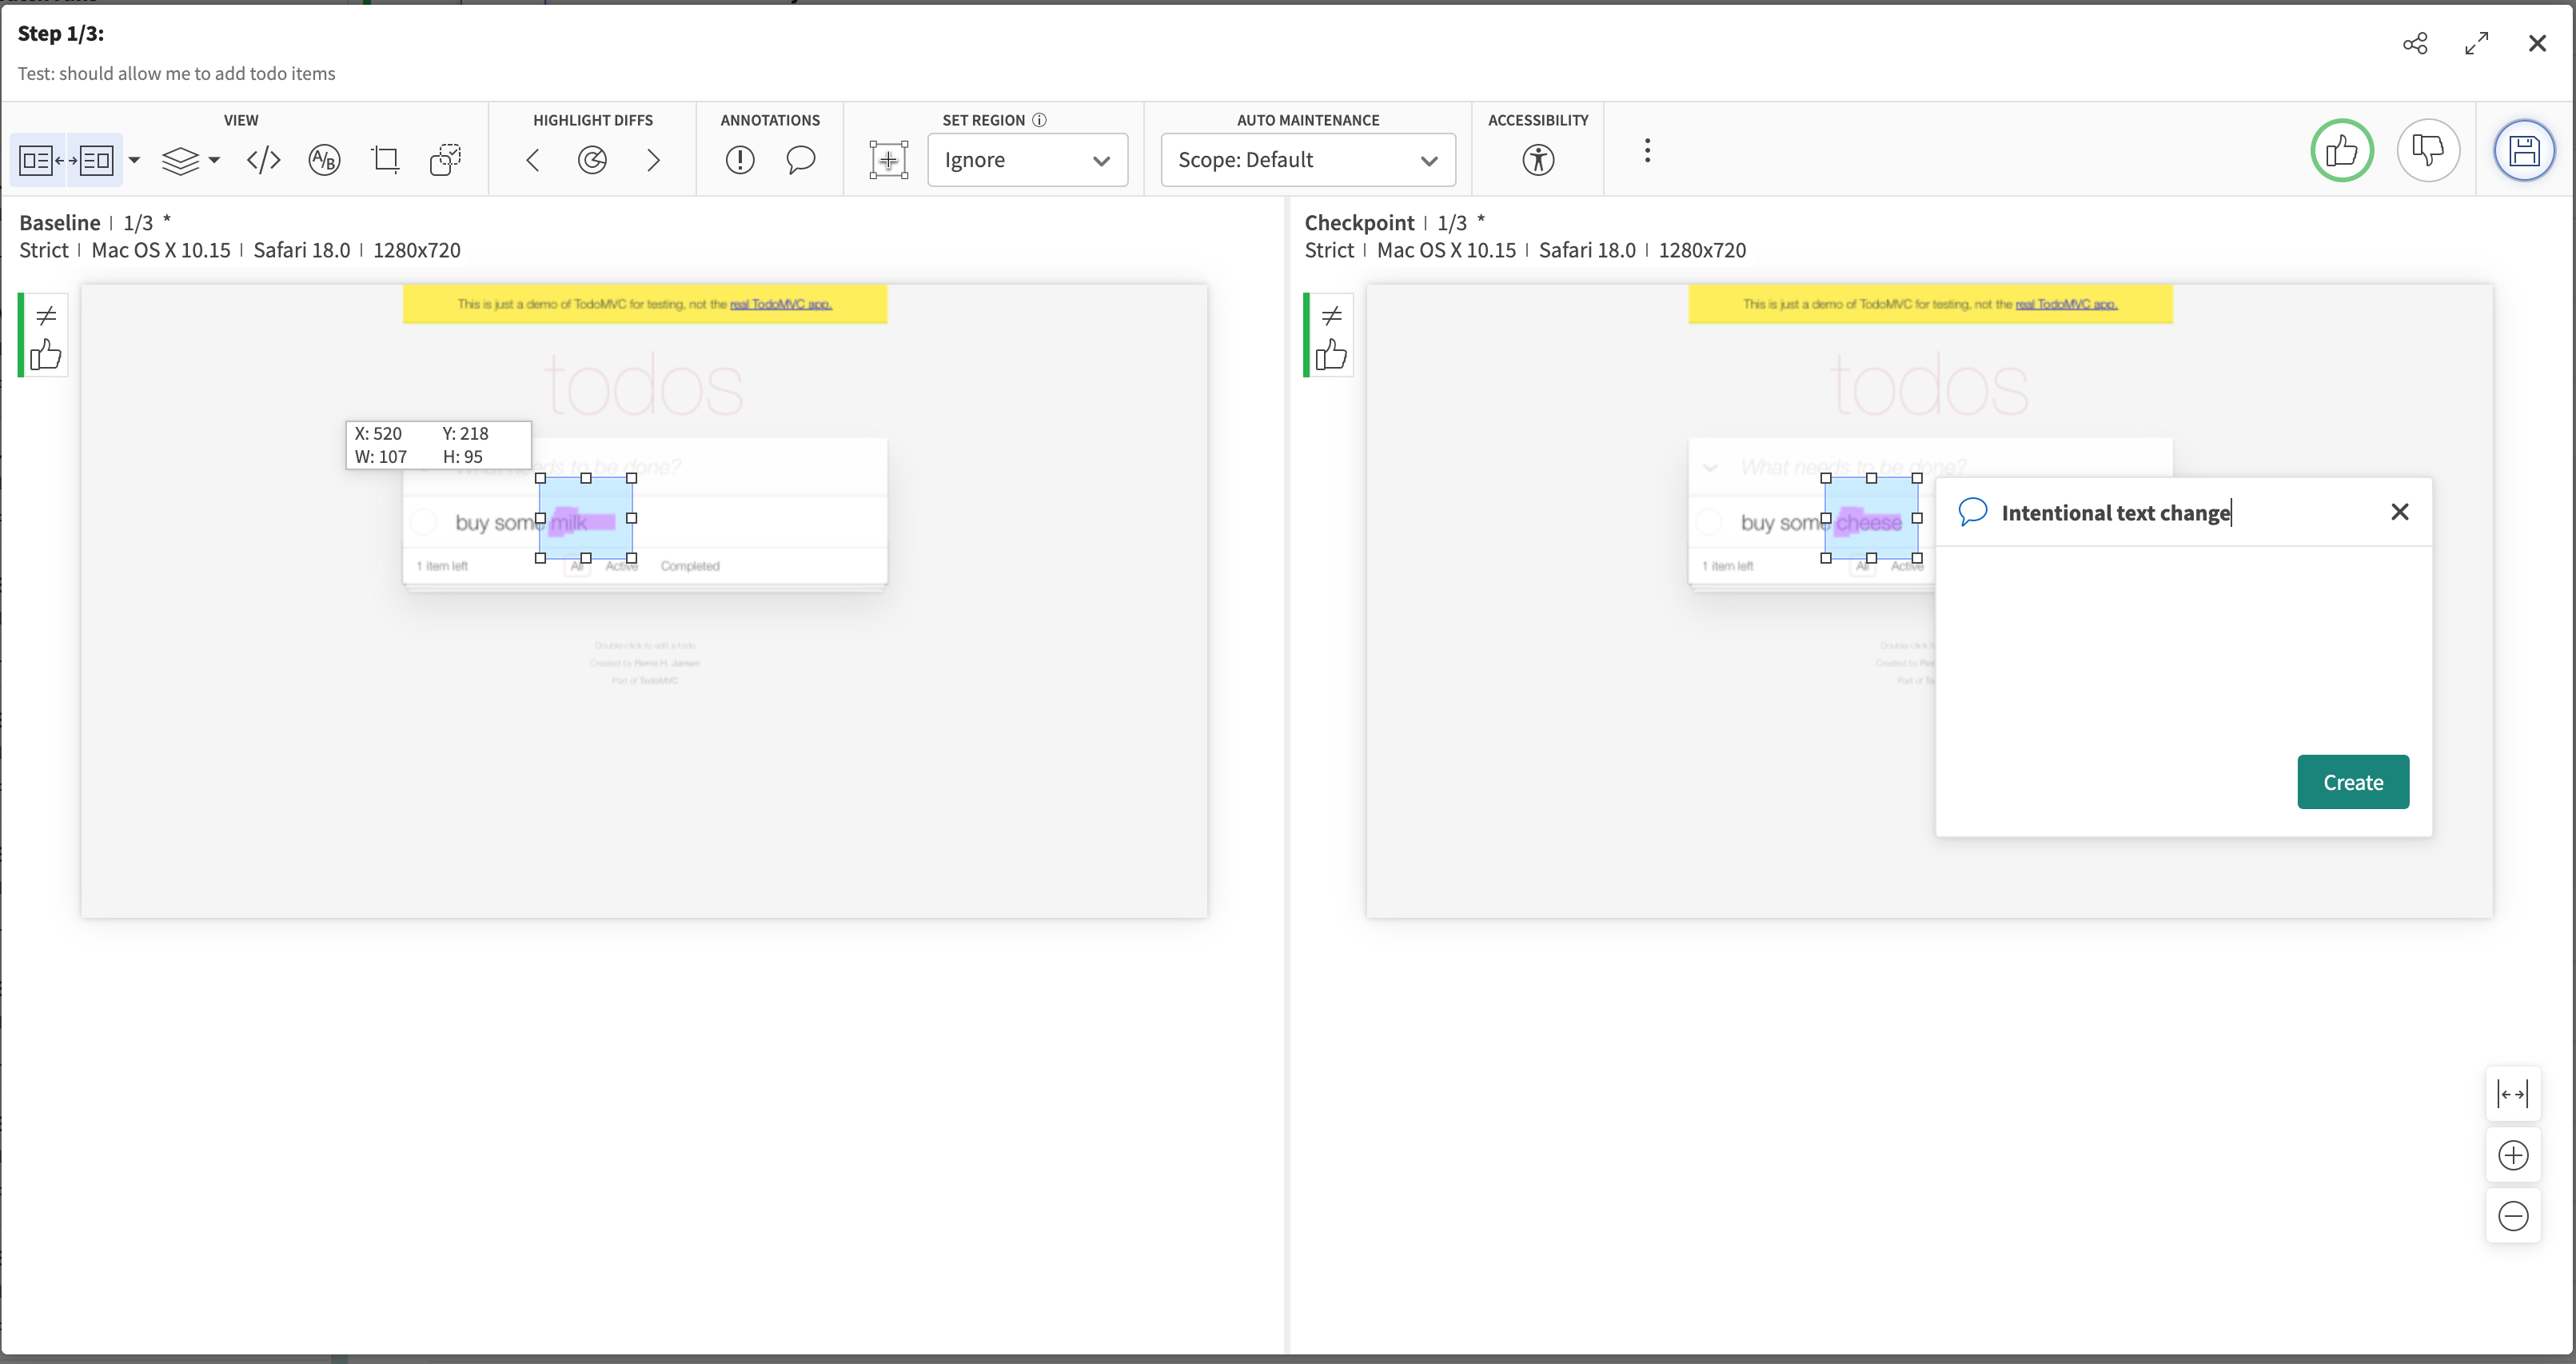
- Bugs: Use tools to highlight areas of concern on the screenshots.
Integrations
Applitools integrates with various tools to enhance collaboration:
- Jira: Create Jira issues directly from the dashboard.
- Slack: Receive notifications and updates in Slack channels.
- GitHub/GitLab: Link test results to pull requests.
Utilizing advanced features
Batch management
- Batch grouping: Organize tests into batches for better management.
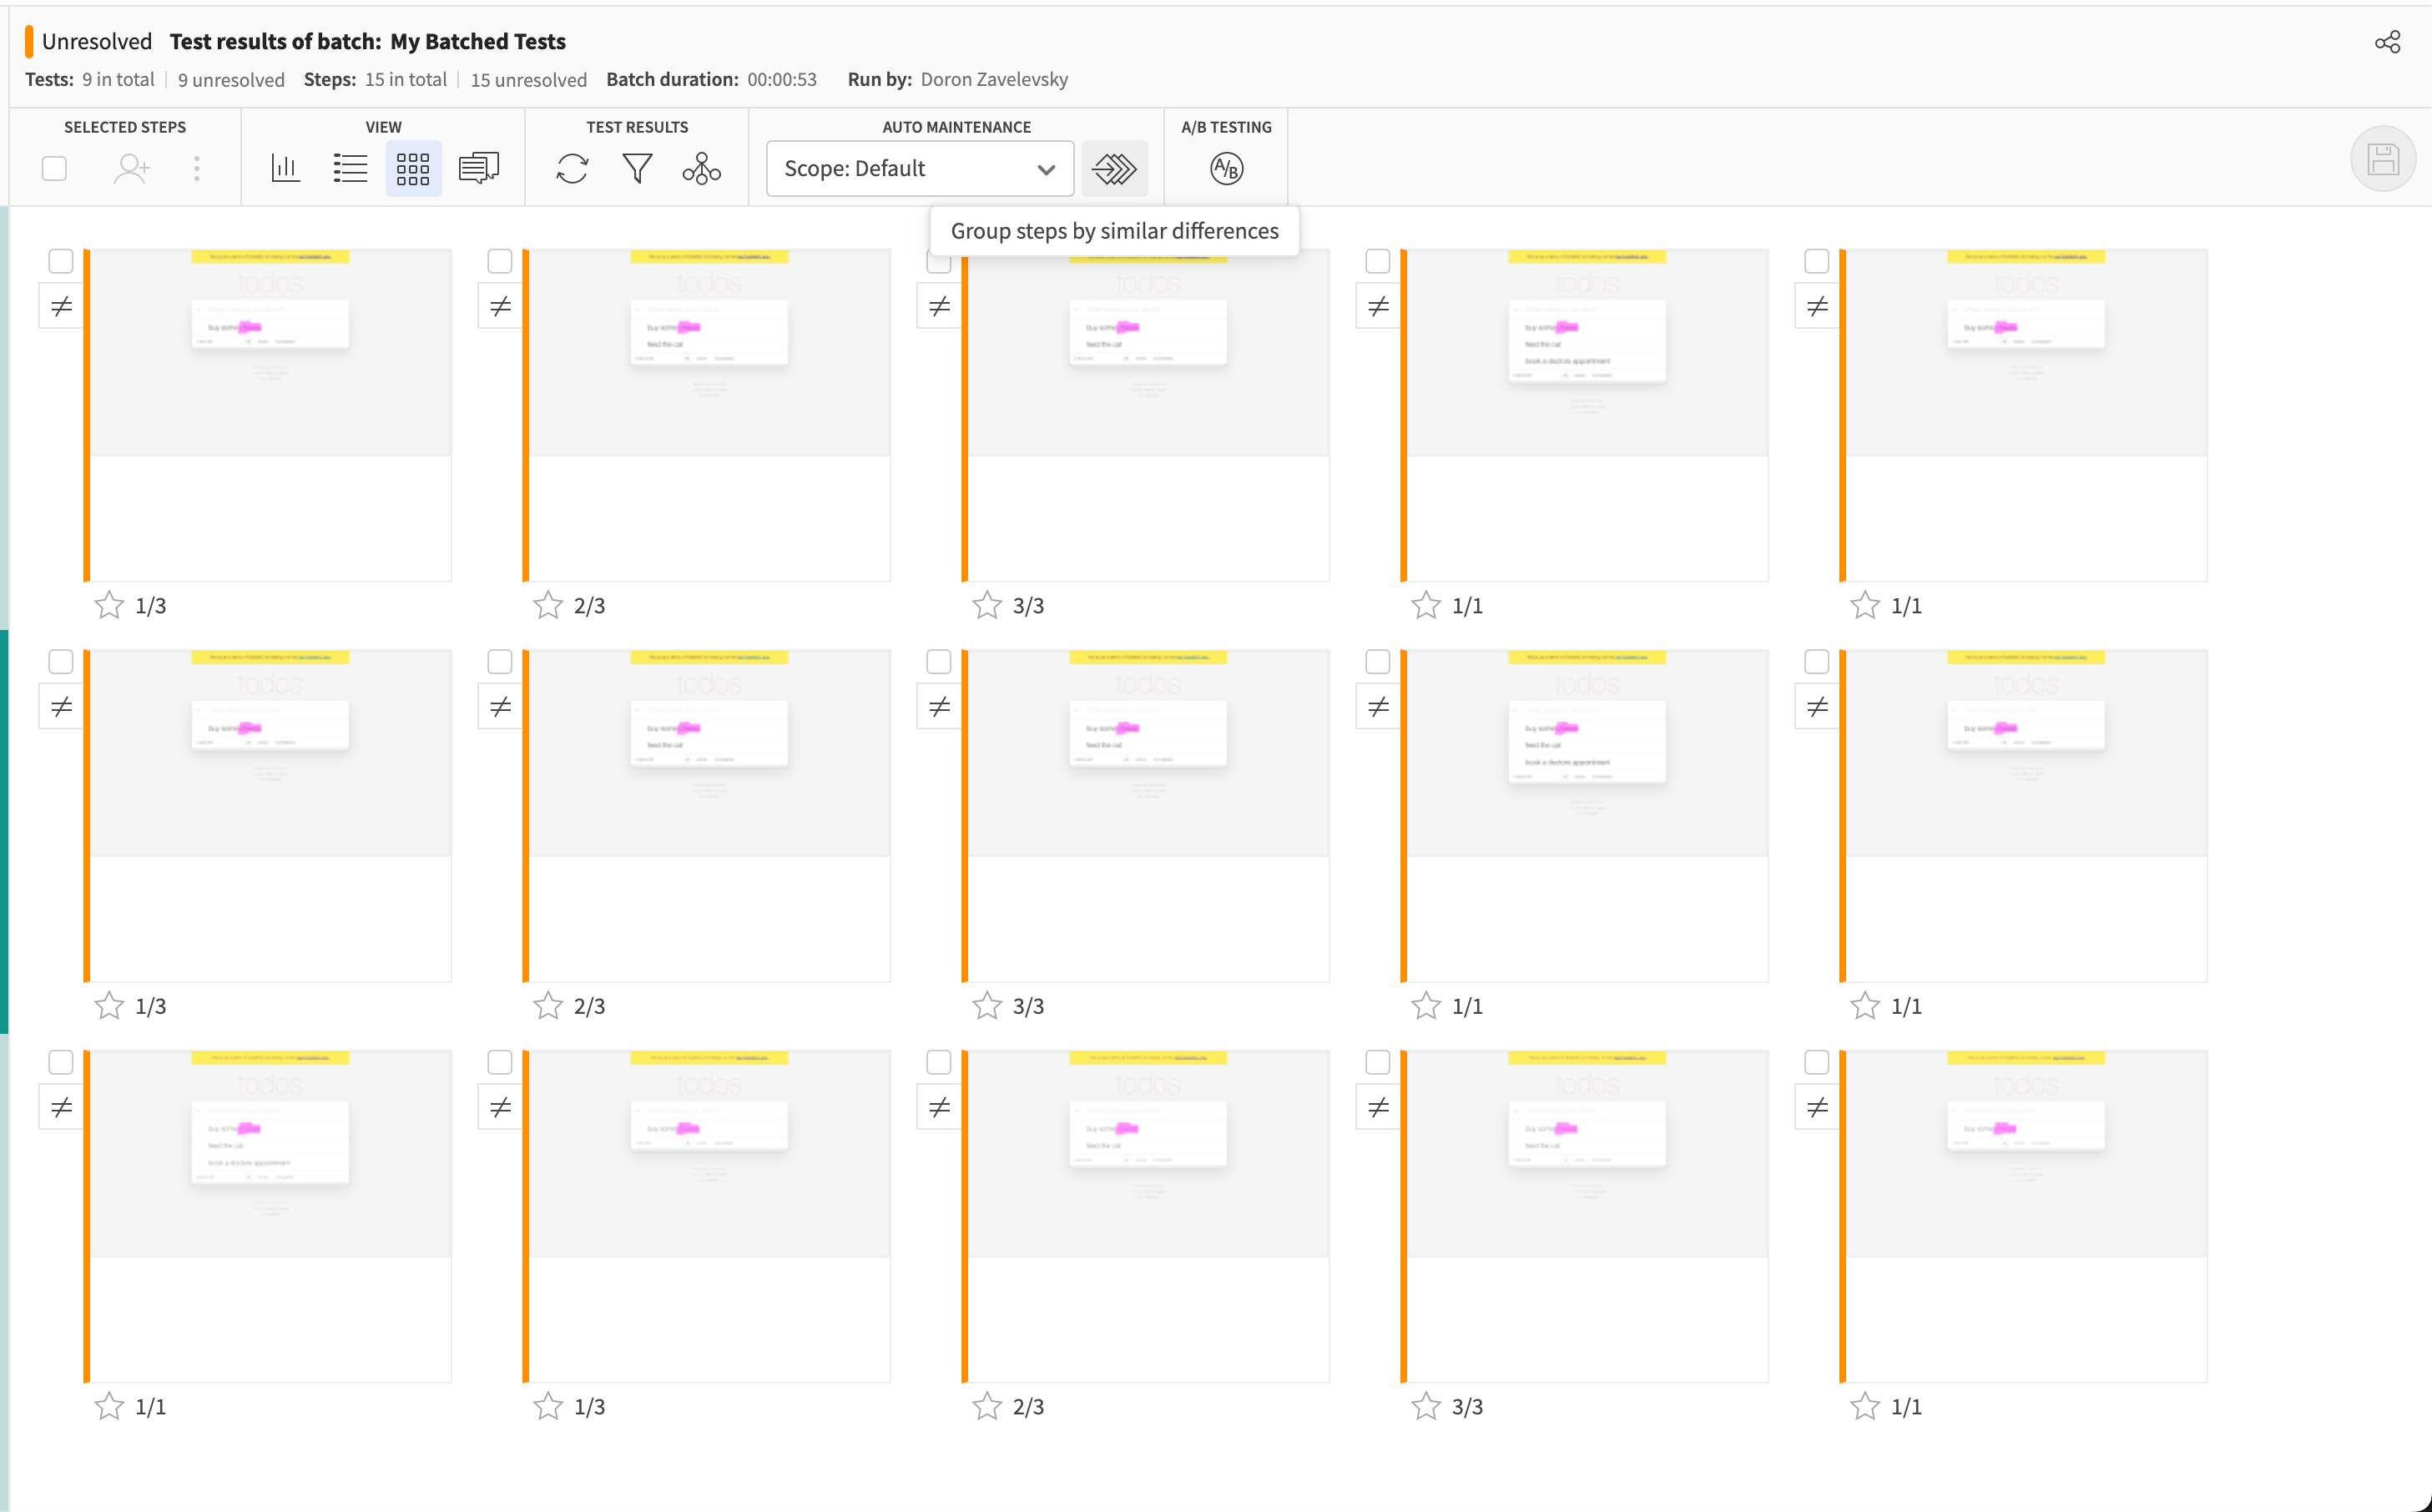
- Batch comparison: Compare entire batches to identify differences across test runs.
Test configuration overrides
- Modify test configurations directly from the dashboard for subsequent runs.
Accessibility testing
- Leverage Applitools to perform accessibility checks alongside visual testing.
Insights and analytics
- Access metrics and trends over time.
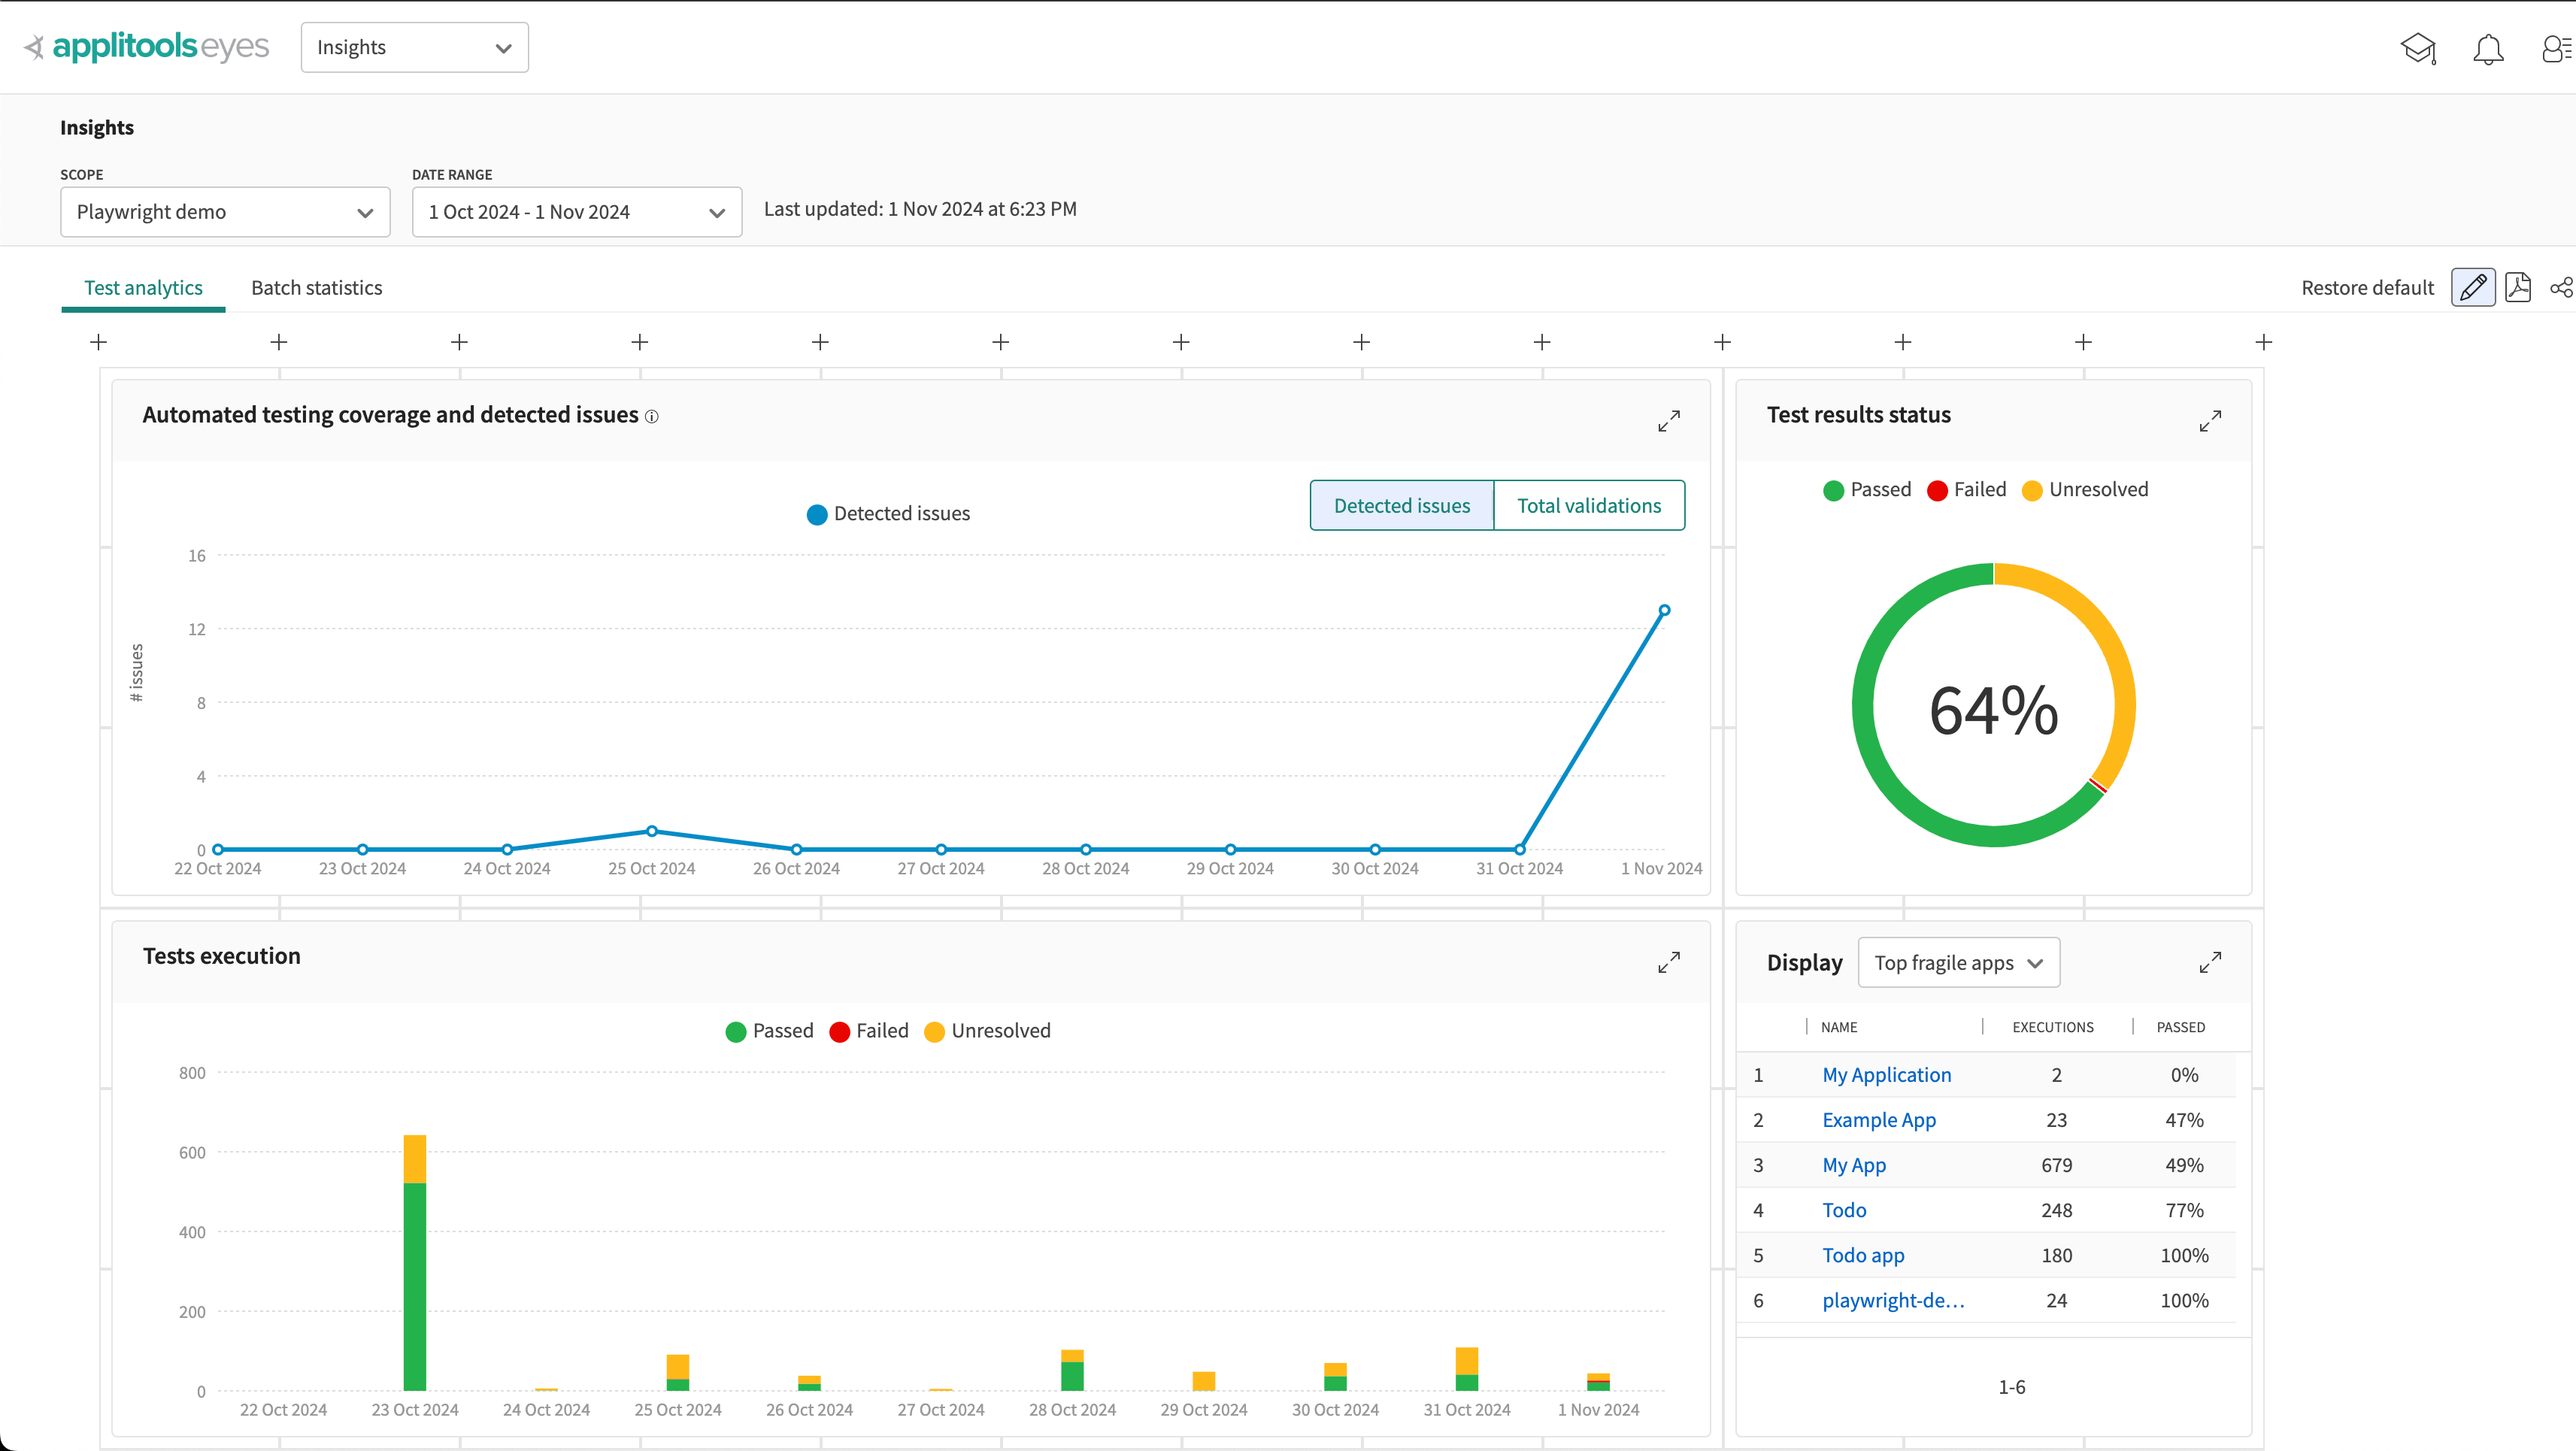
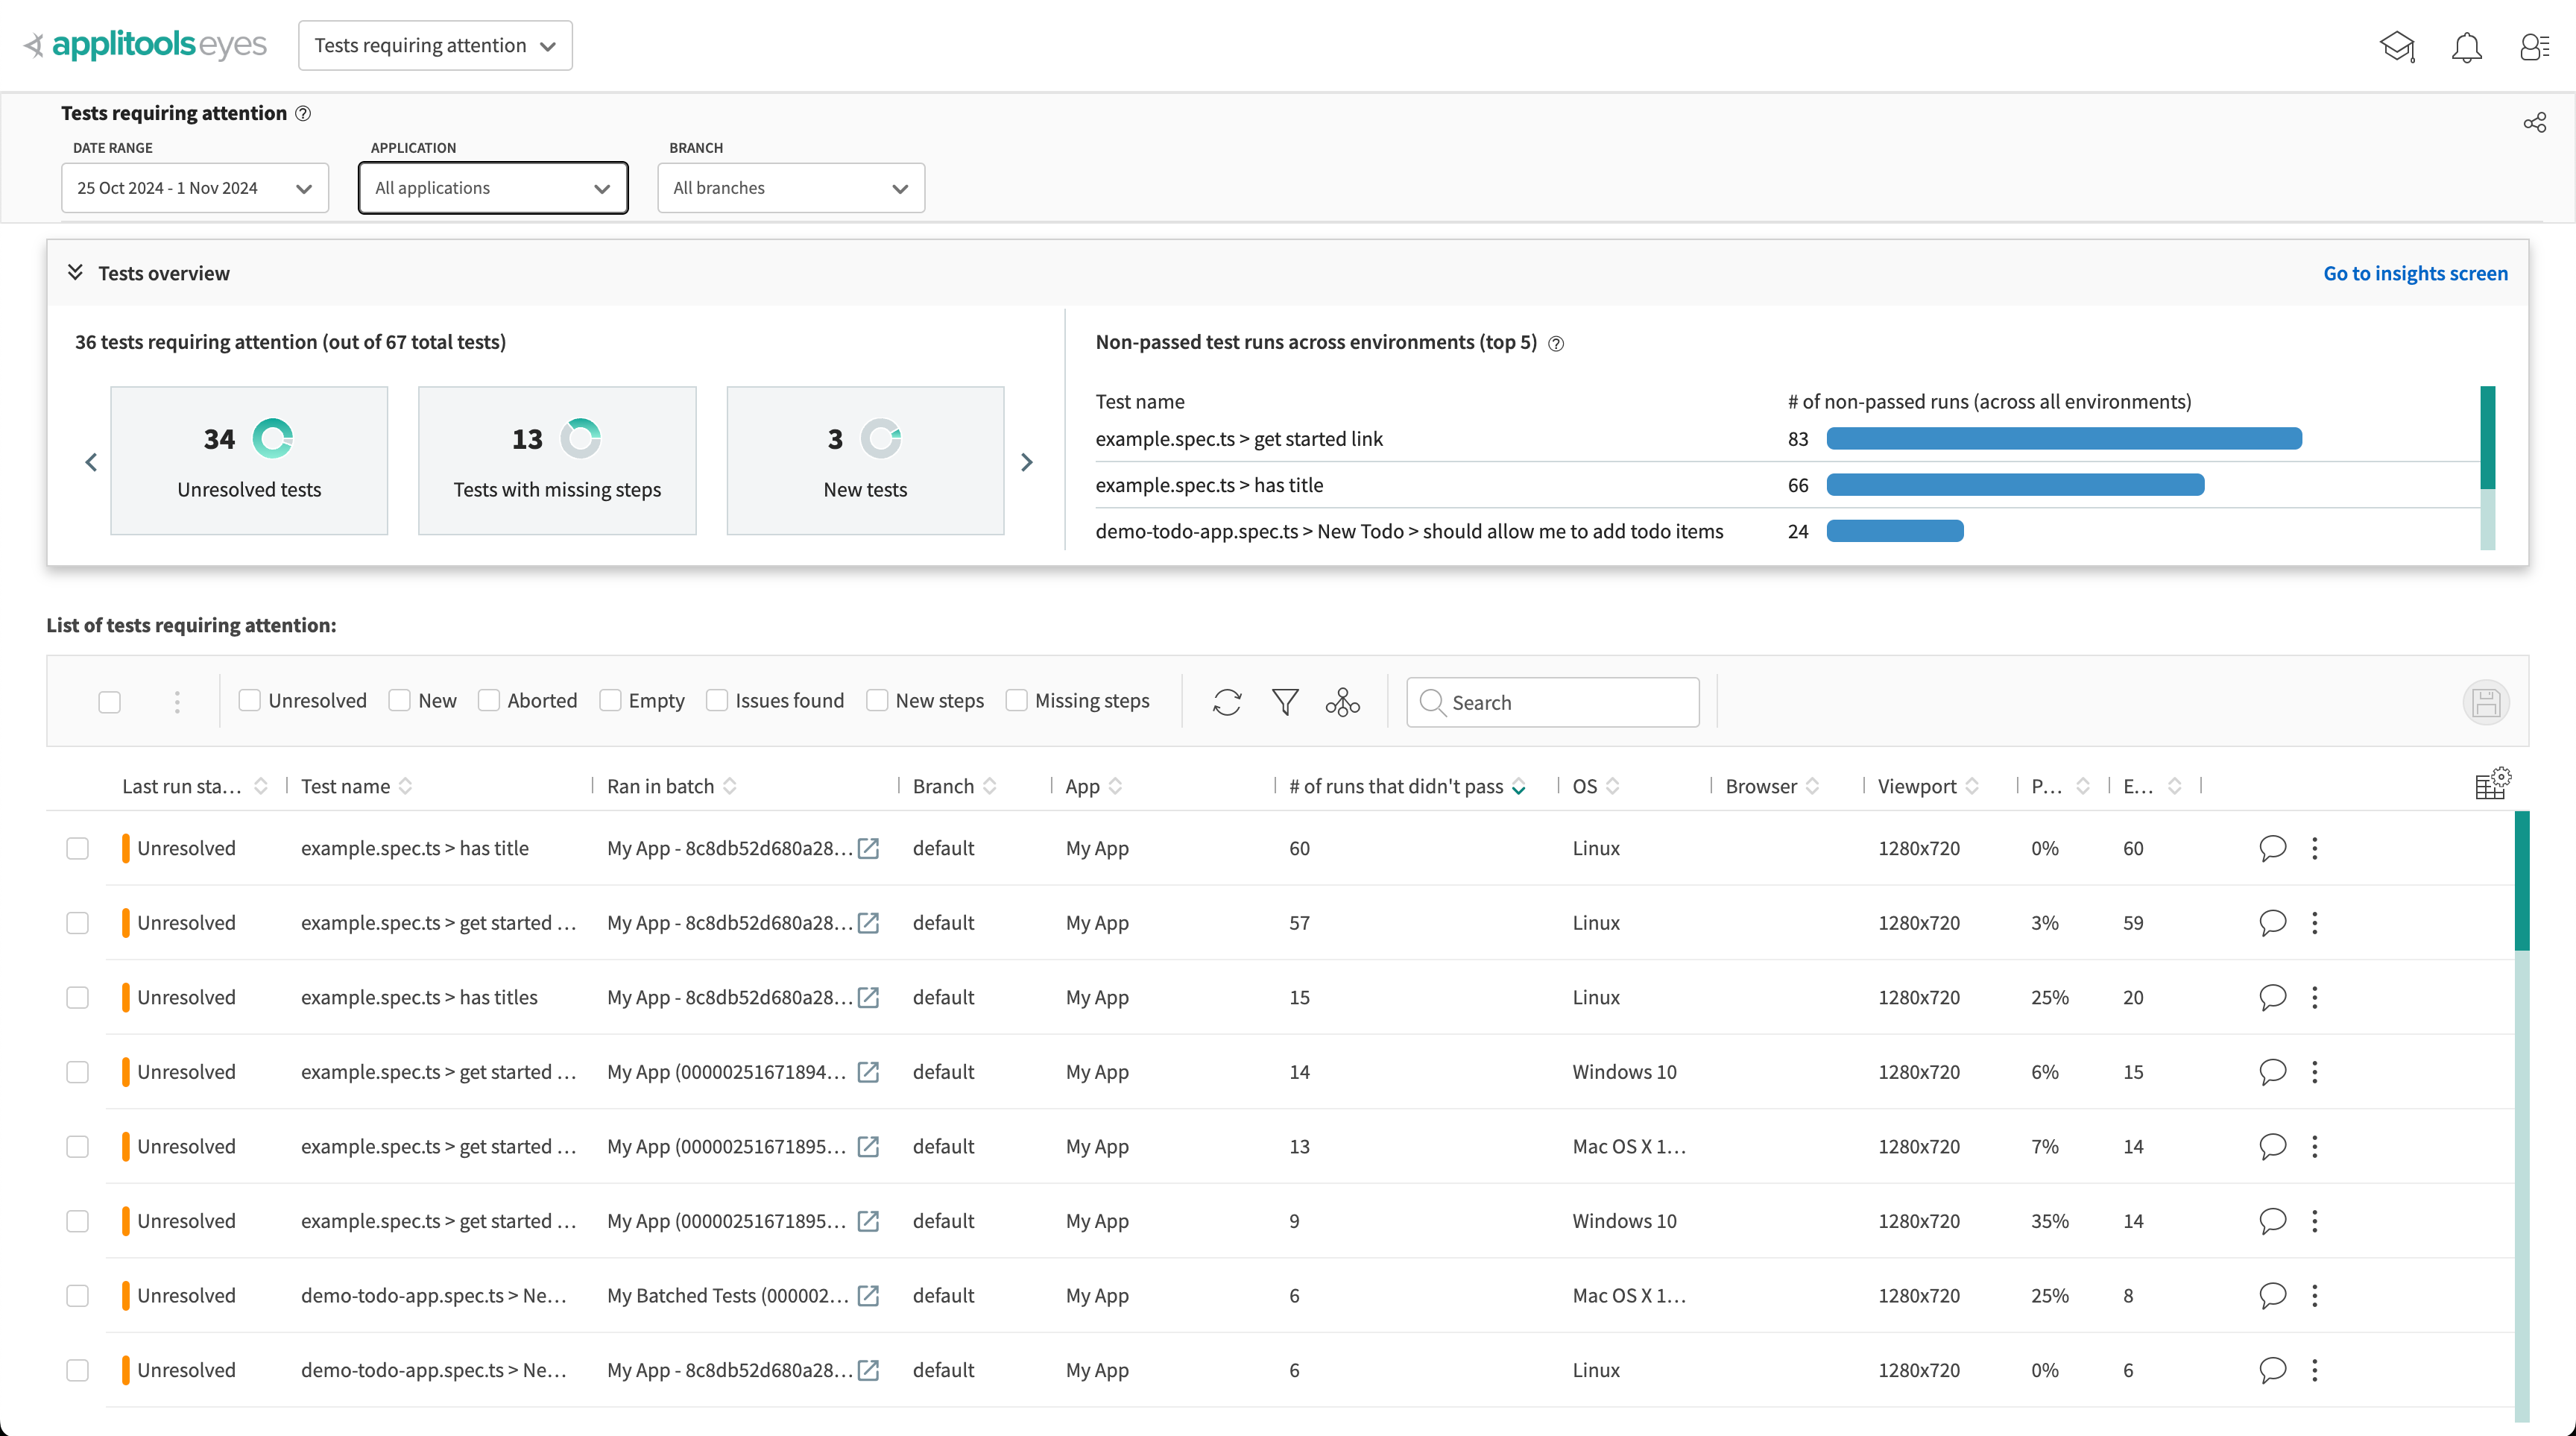
- Identify patterns in test failures or UI changes.
Best practices
- Regular reviews: Schedule periodic reviews of test results to maintain baseline accuracy.
- Collaborative workflow: Encourage team members to participate in reviewing and approving changes.
- Baseline maintenance: Update baselines thoughtfully to prevent masking unintended changes.
- Use descriptive names: Name your tests and batches meaningfully to simplify navigation.