Quickstart Demo for Cypress
Overview
Begin your journey with Applitools by cloning a demo repository and testing a sample application. By the end of this guide, you'll:
- Run your first Visual AI test with Cypress.
- Review and assess the results.
- Understand the value of Visual AI Assertions.
What you'll need
Here's what you'll need to have set up to follow along:
- A code editor like Visual Studio Code or similar
- The latest version of Node and npm
- An Applitools account with an API key
Setting Up Your Environment
Before running the visual test,
set up your API key as an environment variable named APPLITOOLS_API_KEY.
You may set it through your IDE (if applicable),
or you may set it from the command line like this:
- macOS and Linux
- Windows
export APPLITOOLS_API_KEY=<your-api-key>
set APPLITOOLS_API_KEY=<your-api-key>
Installing Applitools
Clone the Git repository
The example project is located at https://github.com/applitools/example-cypress-javascript. Clone this repository to your local machine:
git clone https://github.com/applitools/example-cypress-javascript.git
cd example-cypress-javascript
Instead of running git clone, you can download the project as a ZIP file and extract it.
Install dependencies:
npm install
Running a test
Execute the Cypress test case using the following command:
npm test
Reviewing The Results
After the test completes, you should see a test result in your Applitools Dashboard that looks like this:
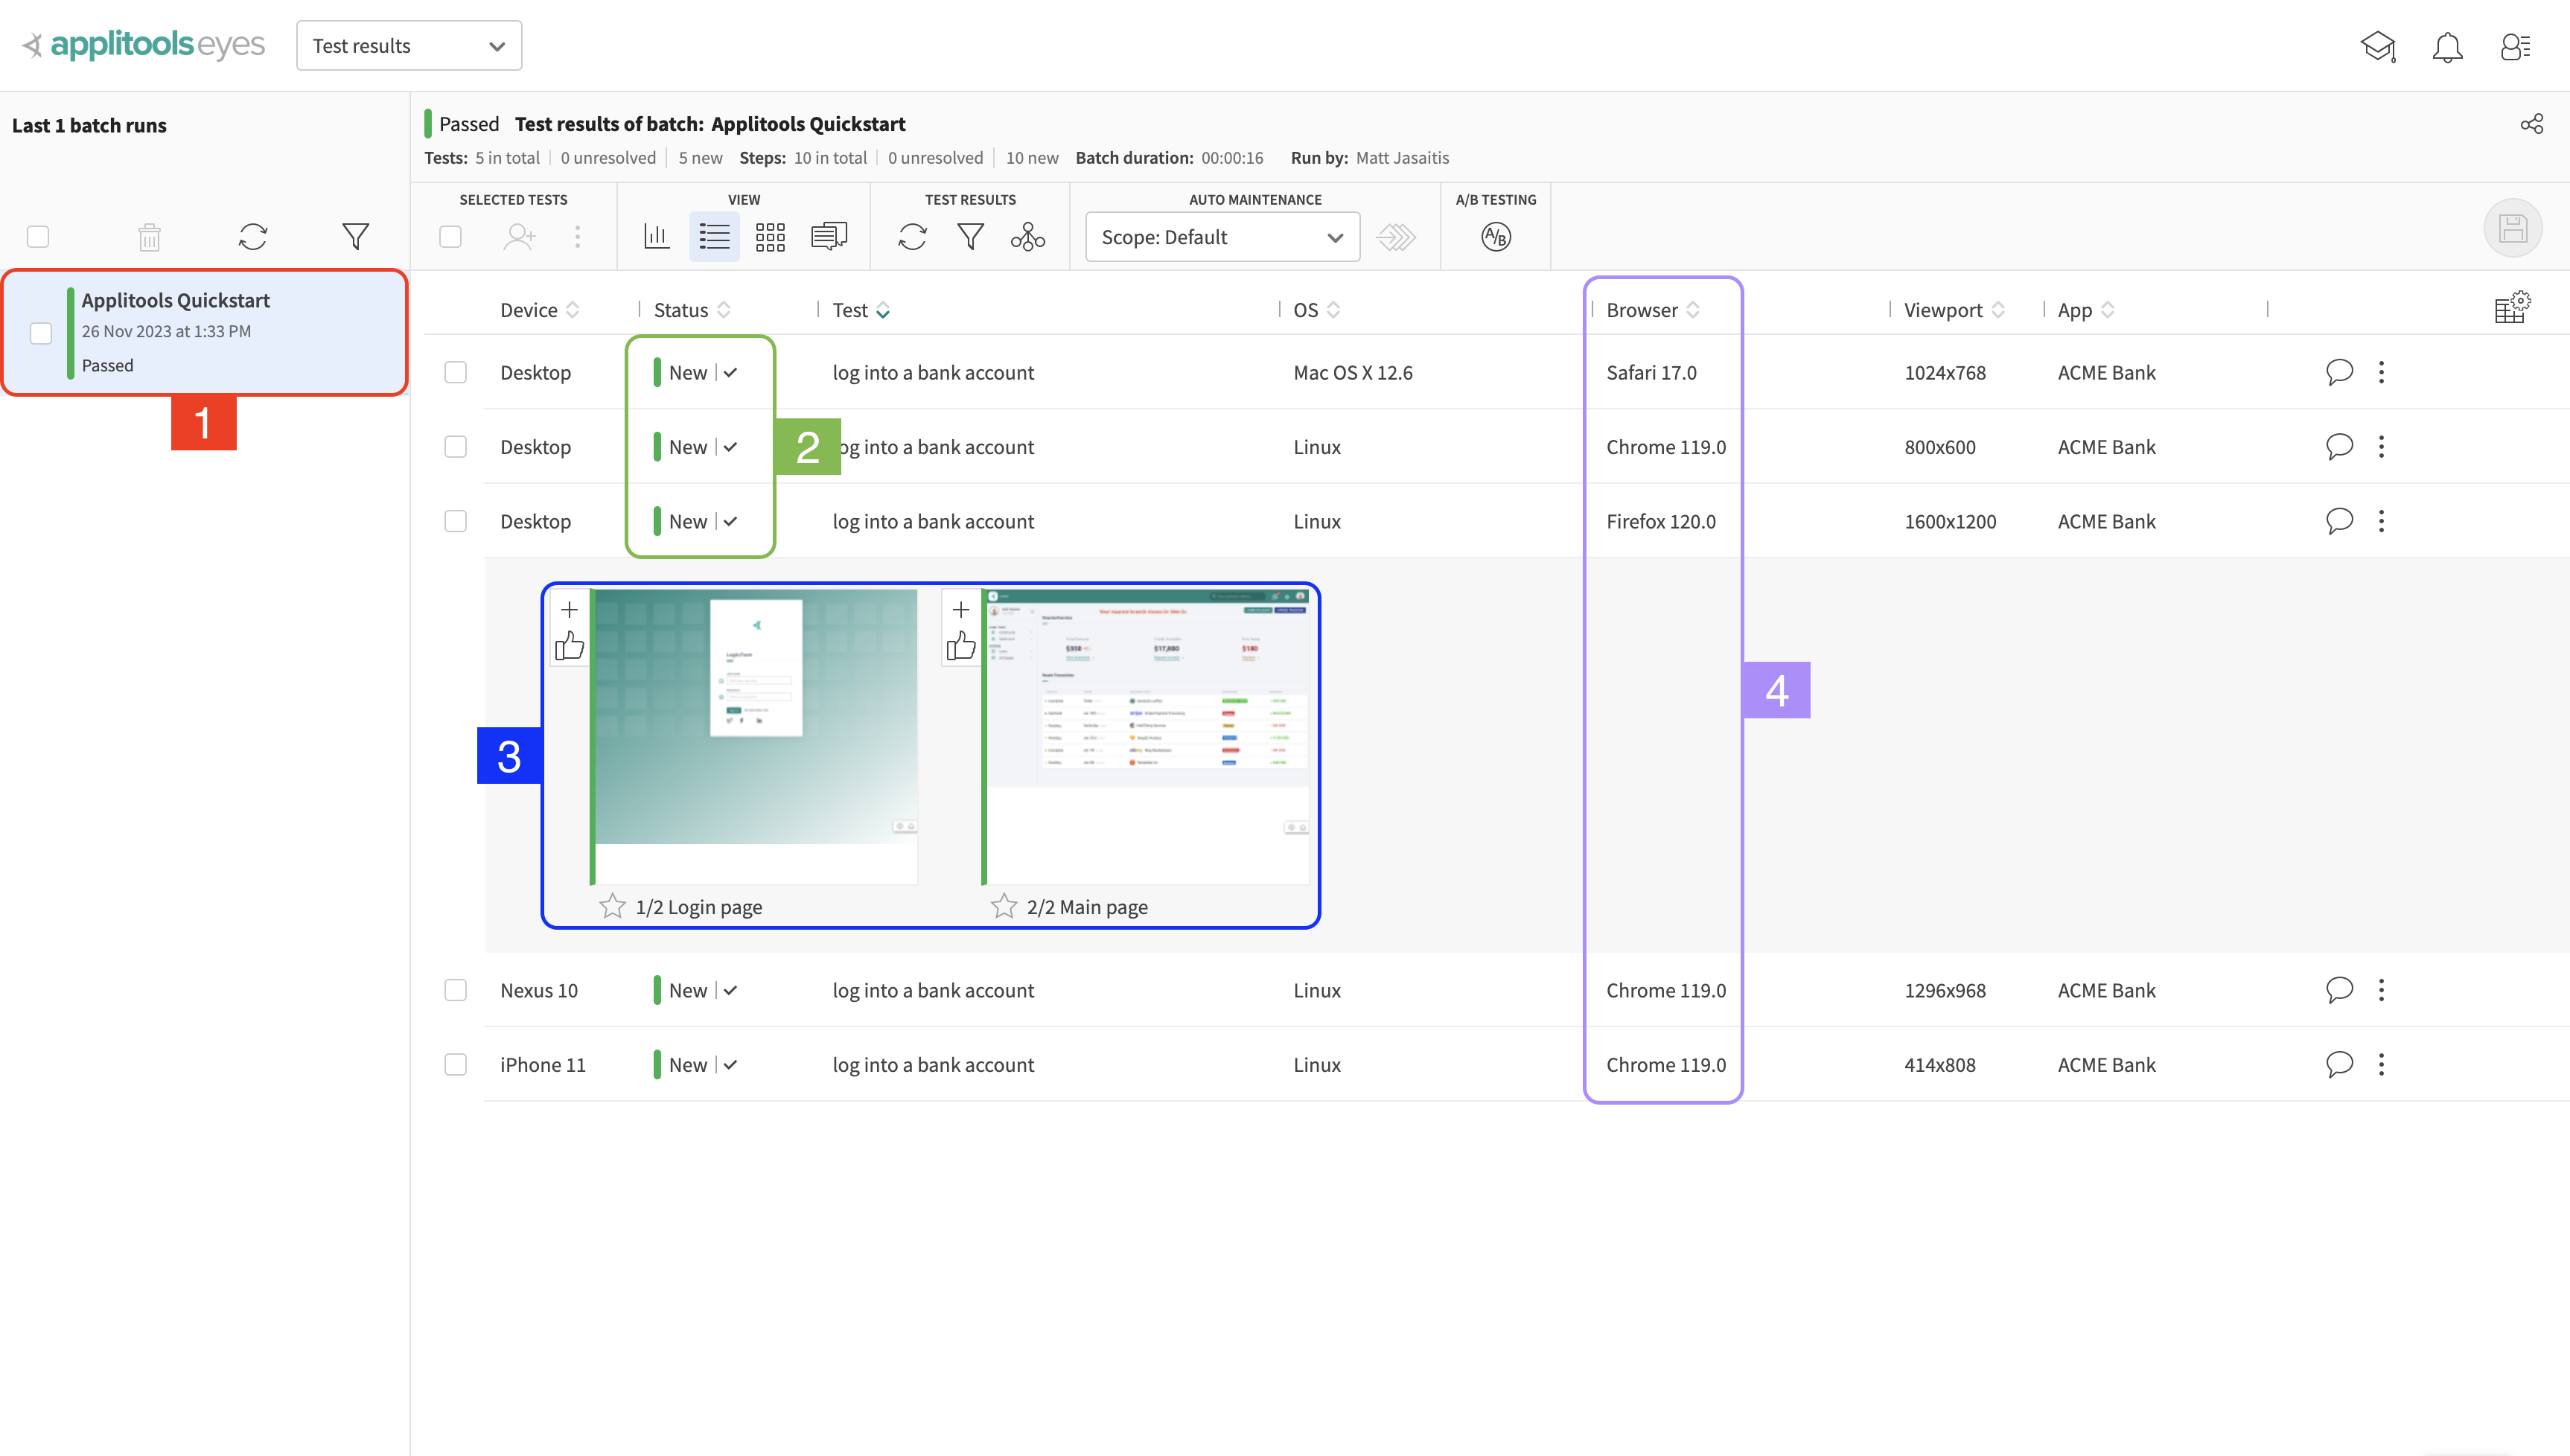
The dashboard is made up of a Batch List on the left side of the screen and a main section that shows us all of the tests that were executed in the selected Batch.
1. Batch List
The section labeled with a 1 on the left side of the screen shows a list of Batches that we've run. A batch can be thought of as an execution of a test suite and can contain any number of tests.
2. Test Status
The section labeled with a 2 shows the status of each test. Every test will have an associated status and in this case the test status is "New". The "New" status means that it was the first time this test was executed and there is no existing Baseline for this test to compare against. Therefore, the images from this test run will be automatically saved as the Baseline going forward.
3. Test Steps
The section labeled with a 3 shows us the steps for a selected test. To reveal these images, click on one of the Tests in the main view.
A step corresponds to a call of the cy.eyesCheckWindow() method in our automation code. Since we called this method twice in the example test, we see two steps. If you want to investigate an image further, click on one of the image thumbnails.
4. Browser/Device
The section labeled with a 4 shows the browser or device that the test was executed on. We are running this test on the Applitools Ultrafast Grid which is a cloud based browser/device infrastructure platform for test execution.
In our project, we have an applitools.config.js file in the root directory. In this file, you can select which browsers/devices you want to test on:
The options listed in the browser array above correspond with the test results in our dashboard. If we want to scale up or down the browsers/devices we're testing against, we can simply add or remove options to/from this array.
For a full list of the browsers/devices available to you on the Ultrafast Grid, check out this page.
Visual AI Comparison
Now that we've run the test once and created the baseline for these test cases, let's run the test again and see what happens. Trigger the tests again using the same command as before:
npm test
After re-running the test, you should notice that the tests failed and that the test status for the most recent Batch run is now Unresolved instead of New:
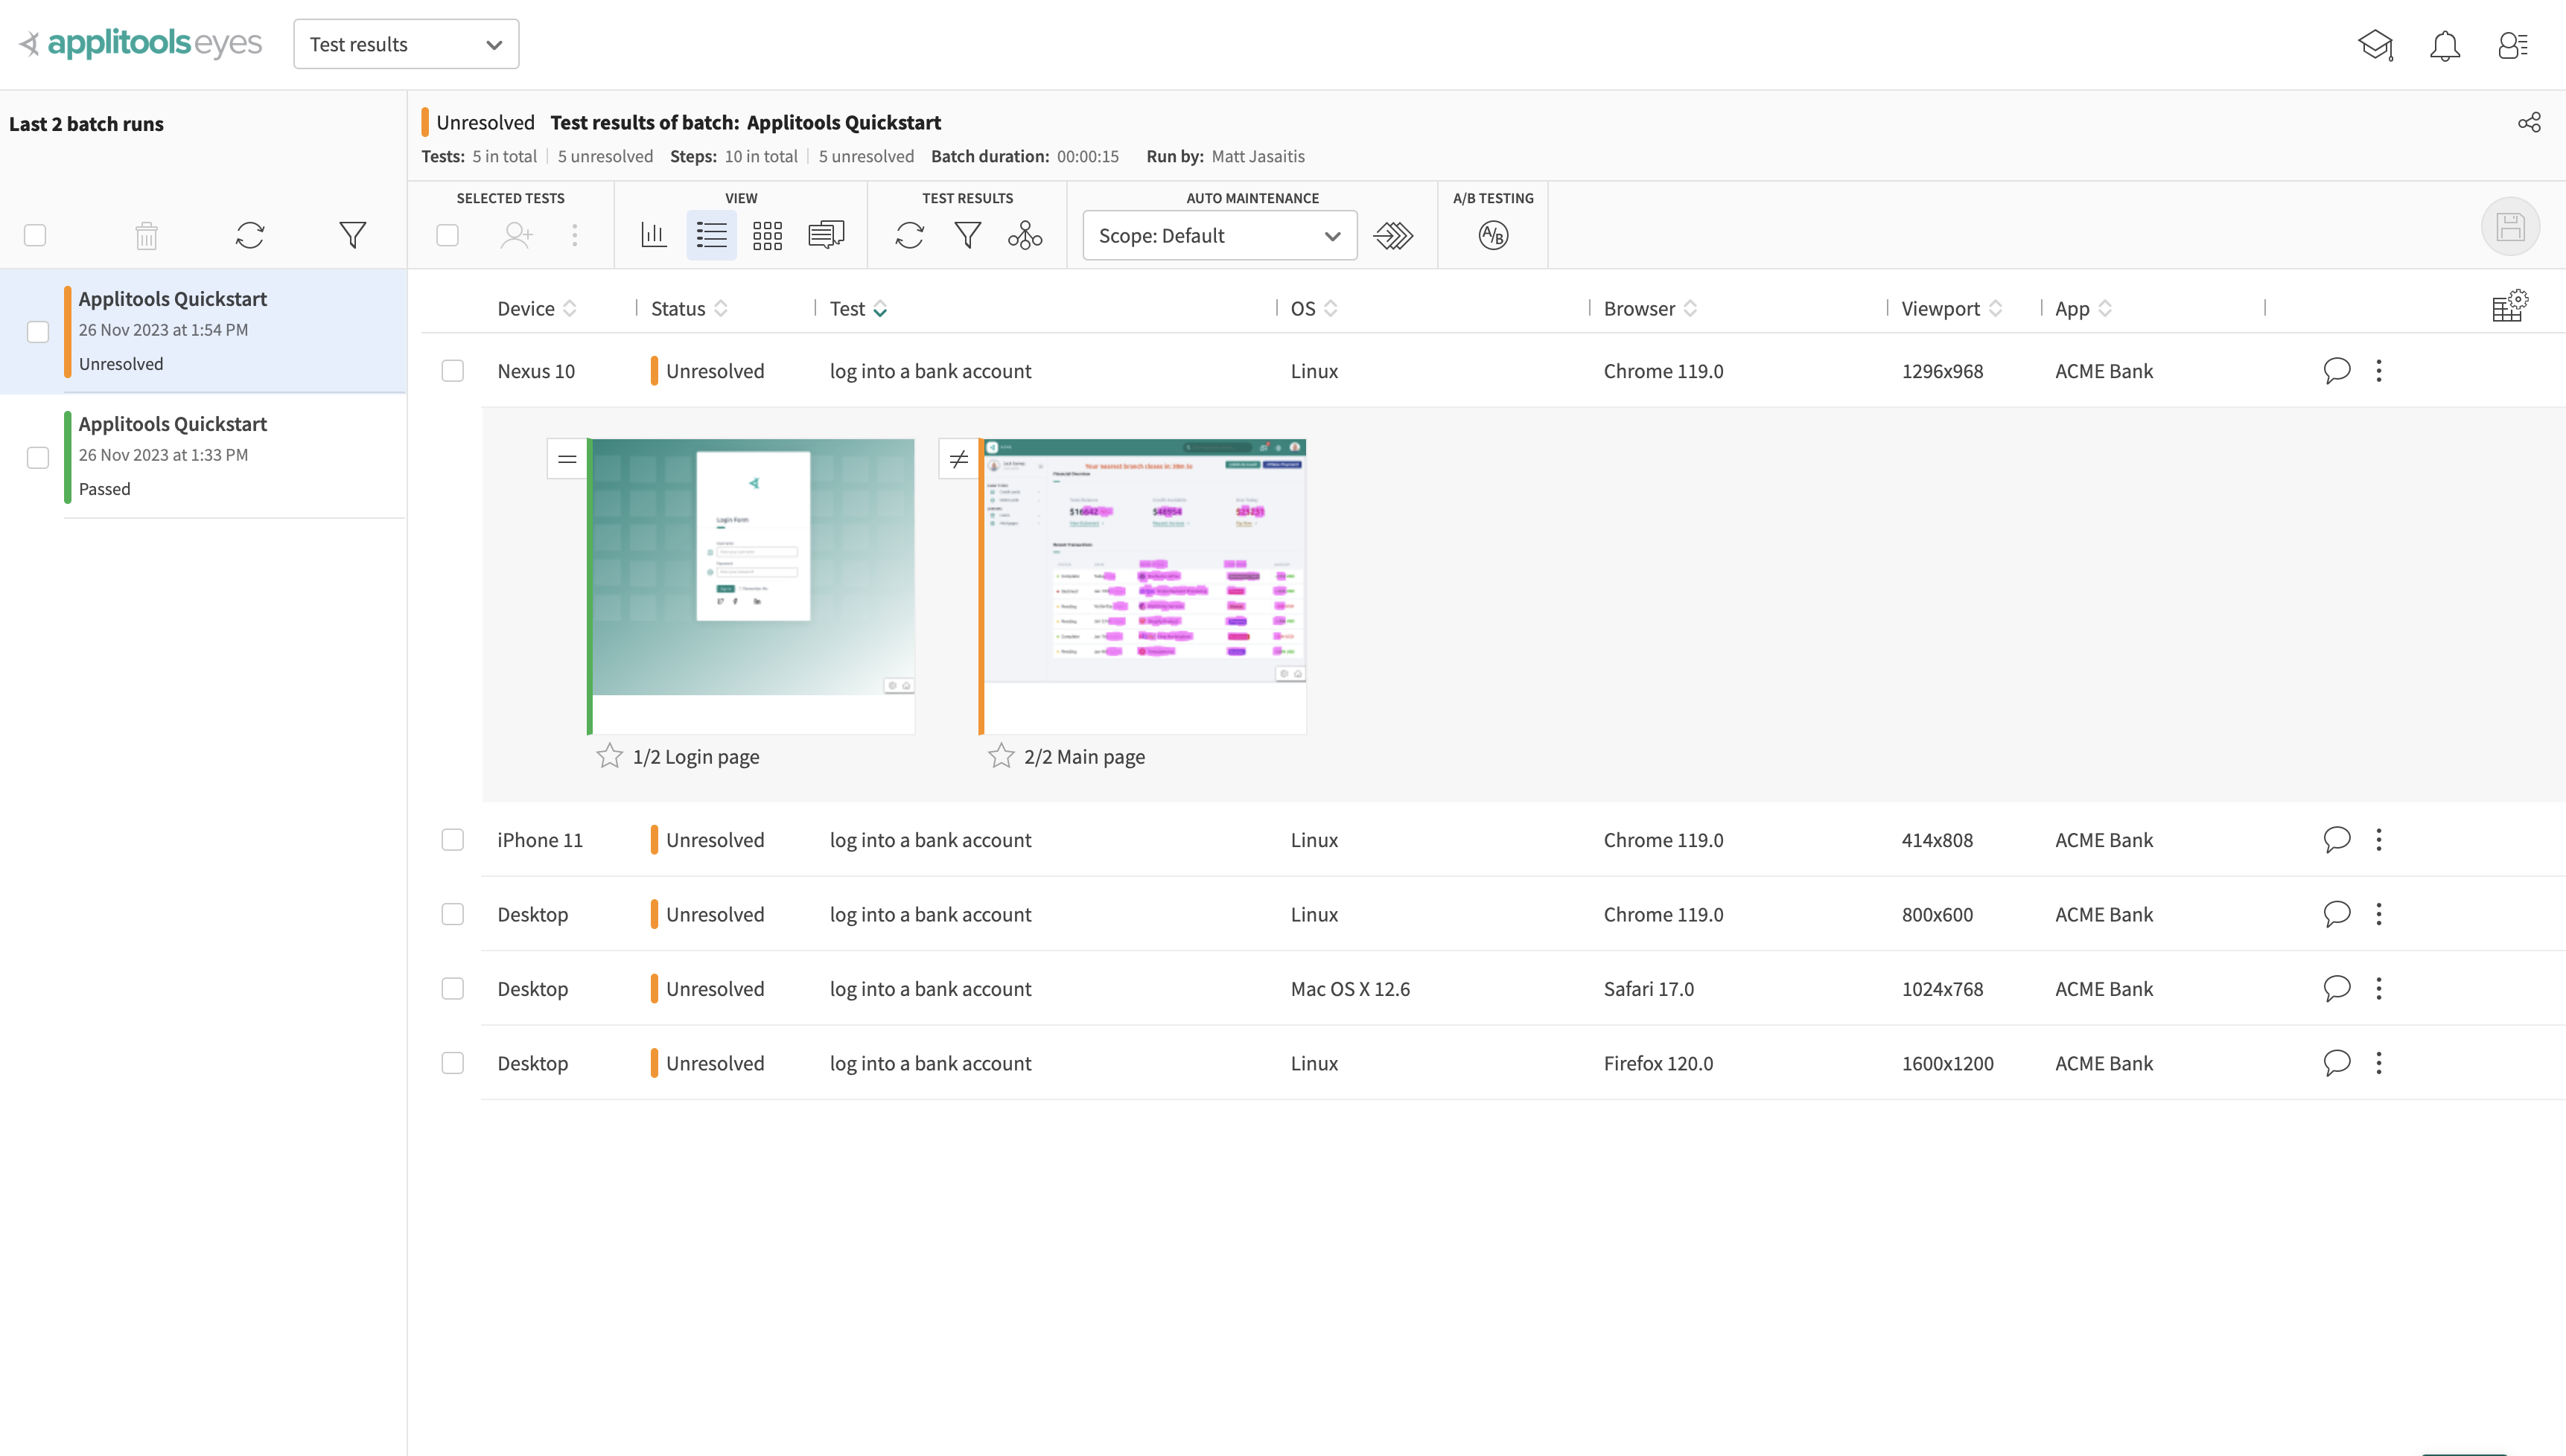
The first step (which captures the login page) passed but the second step (which captures the dashboard page) failed. Click on the thumbnail for the second step to bring up the following view:
Don't see both images after clicking on the thumbnail? Try pressing the s key on your keyboard which will show both images side by side.
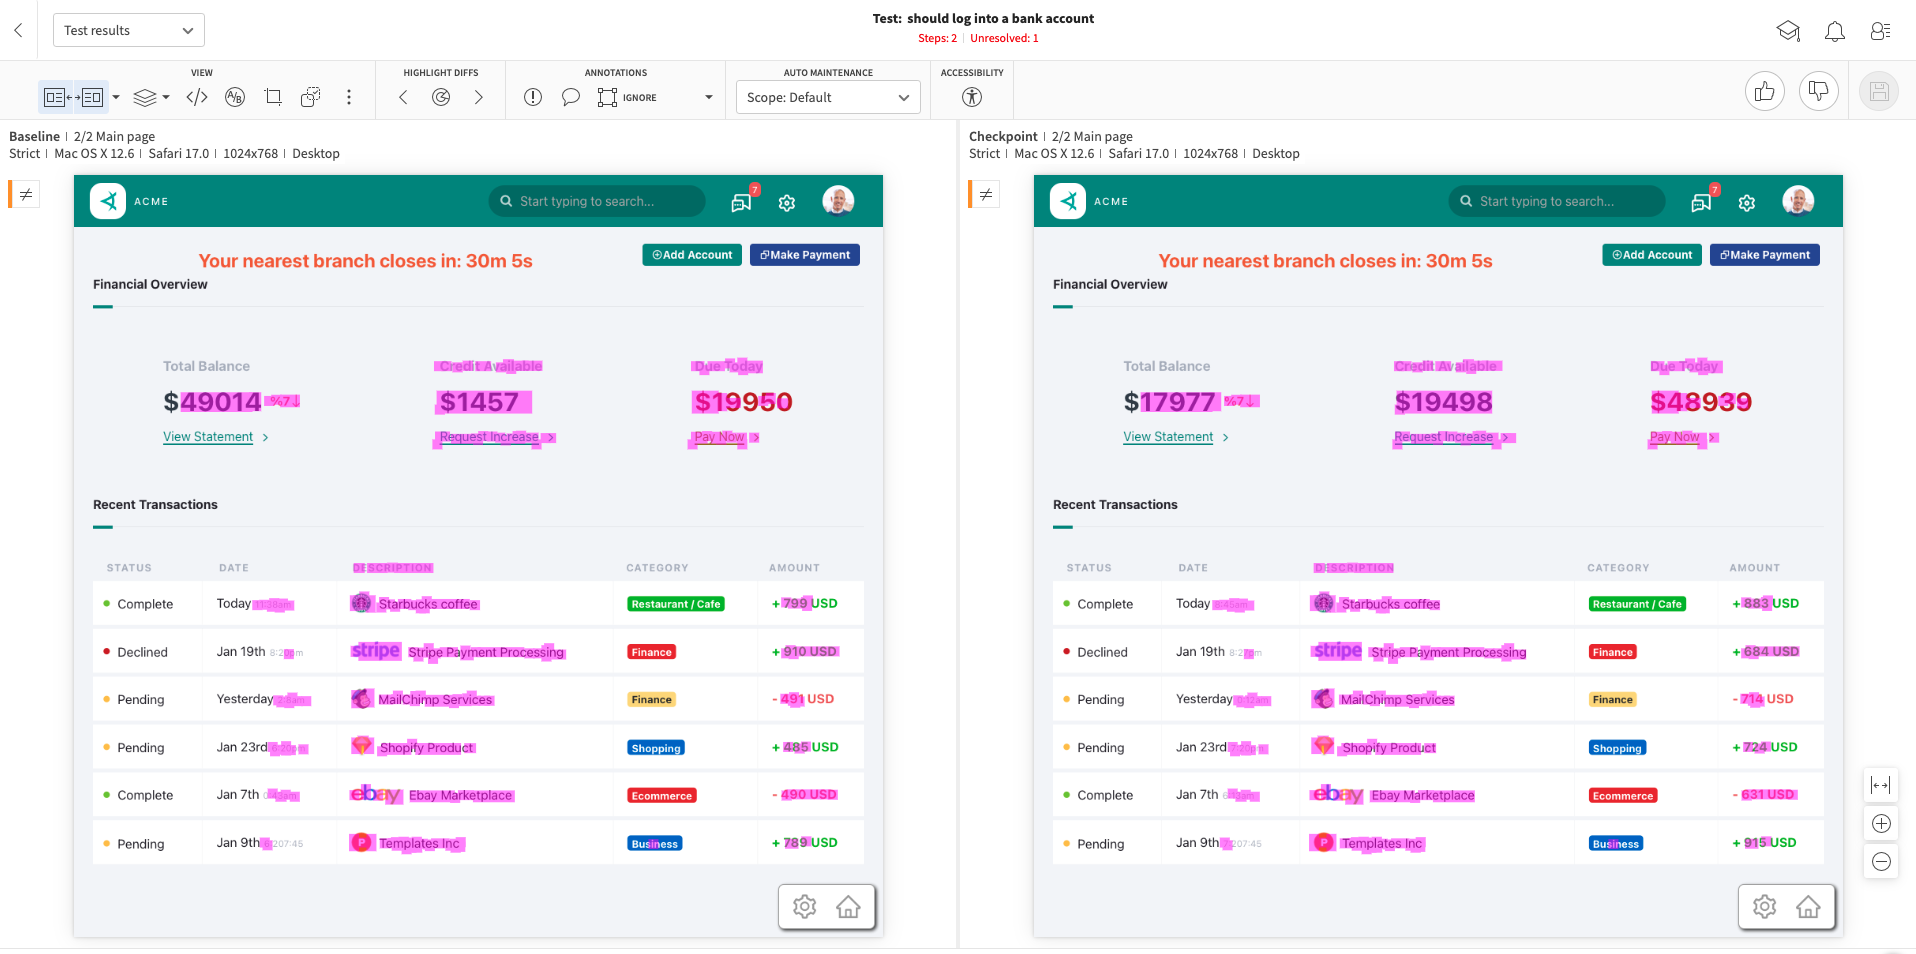
Our test failed becuase the data on our dashboard page is dynamic. This means that each time we run this test, these numbers will change and cause our Visual tests to fail since the Baseline Image (the image on the left) and the Checkpoint Image (on the right) do not match up.
This is where Visual AI makes handling complex test cases like these a breeze. Without Visual AI, we'd need to either:
- Spend valuable time setting up a testing environment that hardcodes the data that we want and prevents it from changing
- Ignore the regions of the page that are dynamic preventing visual comparison from occurring which leaves you vulnerable to unexpected visual bugs
Rather than either of those, we can take advantage of the Applitools Visual AI and use what's called a Match Level.
Match Levels
A Match Level is an AI algorithm that has been trained to compare screenshots and flag differences between them.
Applitools offers 3 main match levels out of the box available to all users:
- Strict (Default) - Trained to only flag differences discernable to the human Eyes
- Ignore Colors - Same as Strict except ignores changes in color
- Layout - Only flags differences to the overall structure and relative positioning of elements on the page. Dynamic content will not be flagged.
You can read more about Match Levels and how to use them here
The test we just ran is using the Strict Match Level which is why there are many differences flagged. However, you may have noticed that the Layout Match Level is trained to not flag dynamic content.
We can use element selectors in our automation code to apply different Match Levels to specific sections of our page. Let's modify our automation code to use the Layout Match Level for the dynamic sections of the page. Change the 2nd call to cy.eyesCheckWindow in the /cypress/e2e/simple-example.cy.js file to match the following:
cy.eyesCheckWindow({
    tag: "Main page",
    layout: [
        {selector: '.dashboardOverview_accountBalances__3TUPB'},
        {selector: '.dashboardTable_dbTable___R5Du'}
    ]
});
The full test code should now look like this:
After making those updates, run the test again:
npm test
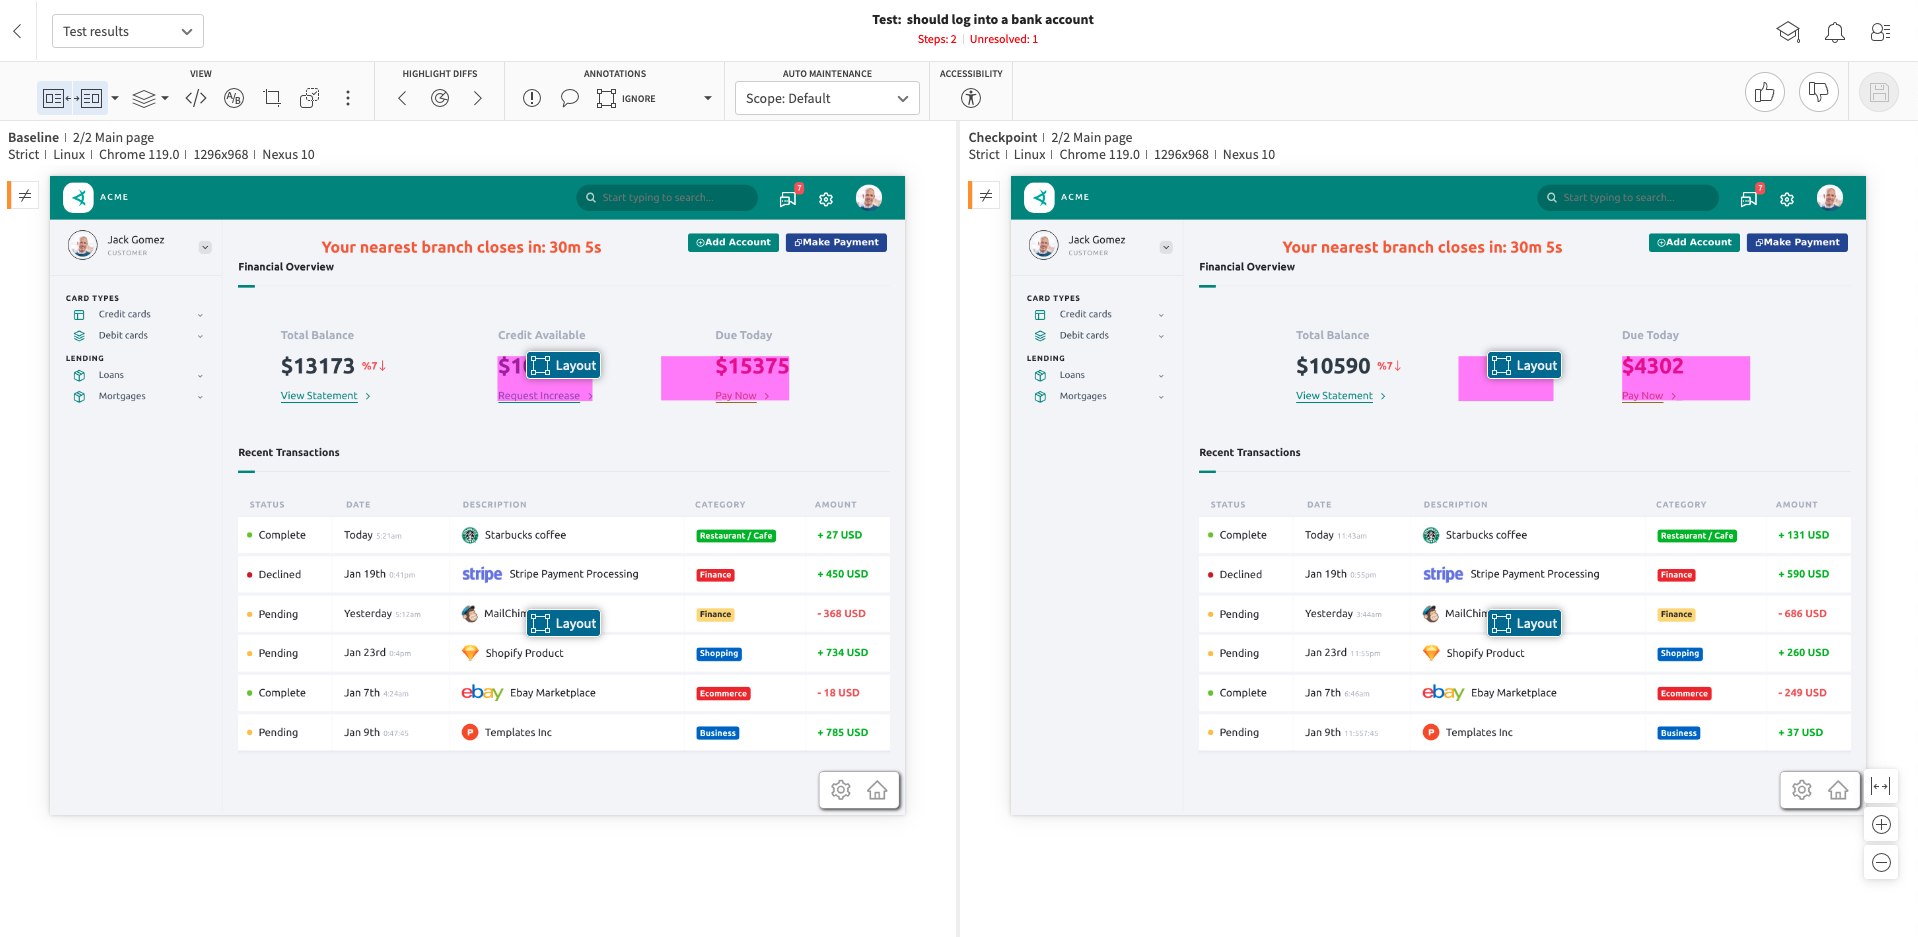
As we can see, our test now passes after applying the Layout Match Level to the dynamic portions of our page:
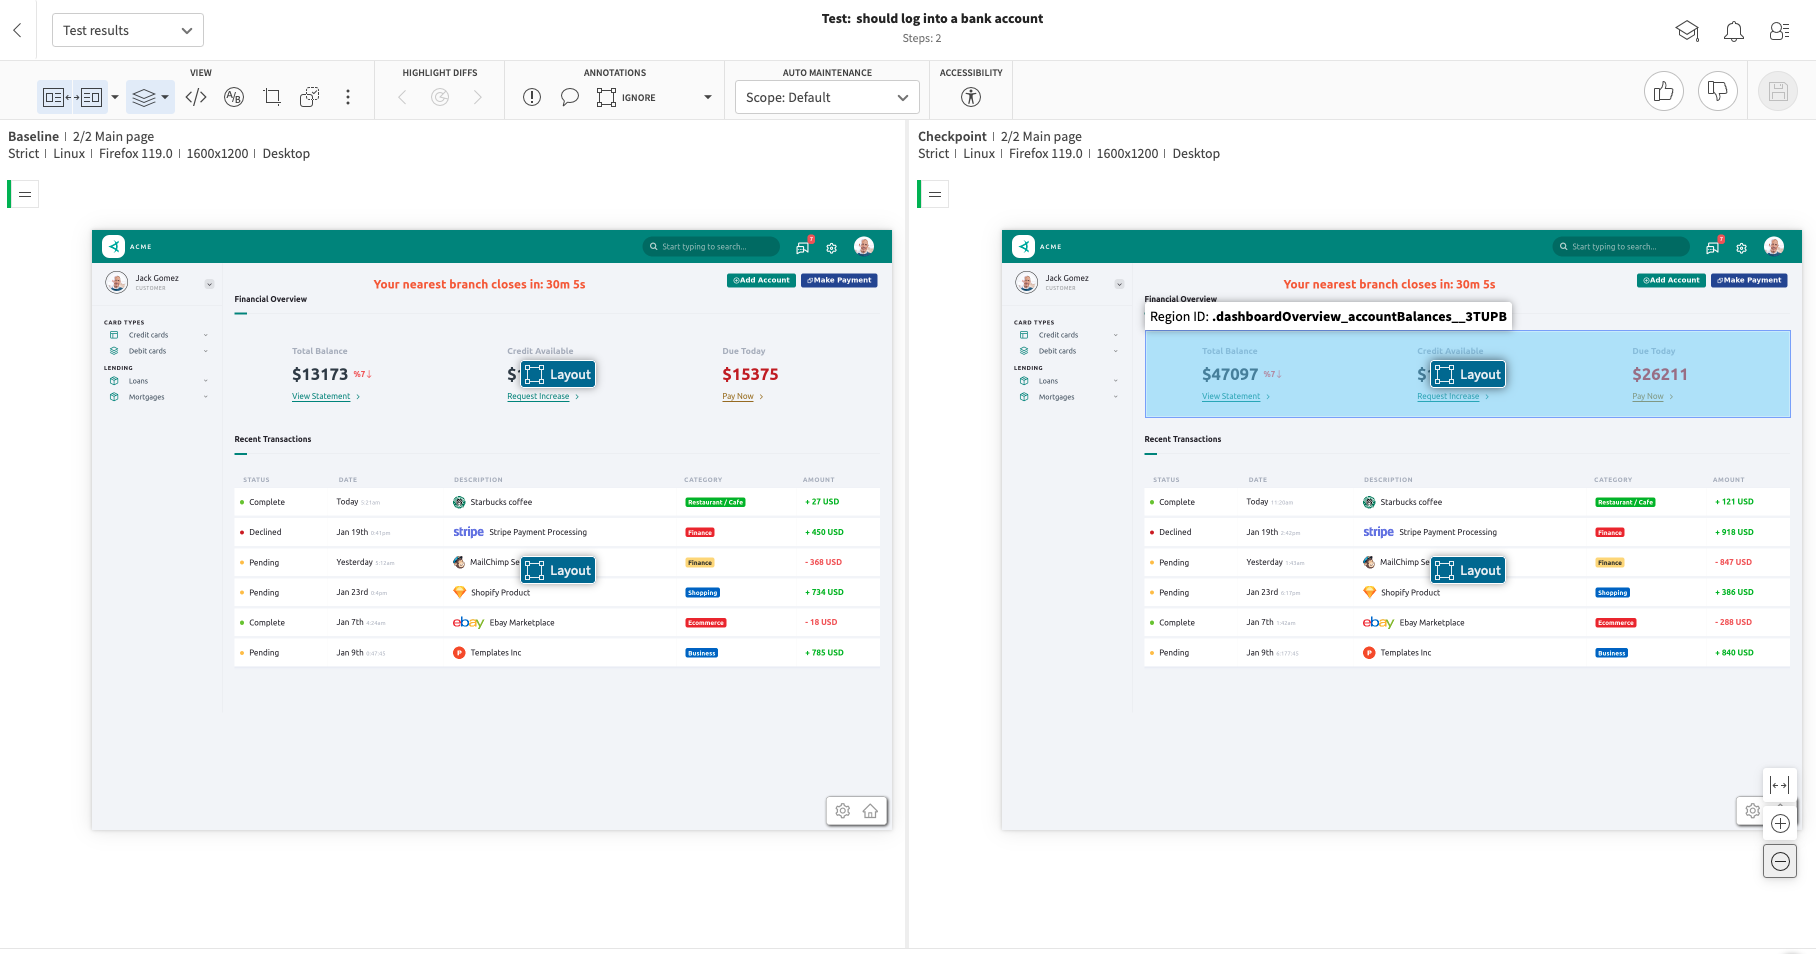
This is because the Applitools Layout Match Level is gracefully handling the dynamic data on the page so that our tests won't fail repeatedly even though the data is changing.
The powerful part about this is that we're not simply ignoring these sections either. If an element was removed or failed to load, the Layout Match Level would notify us and fail the test: