Plan Tests View
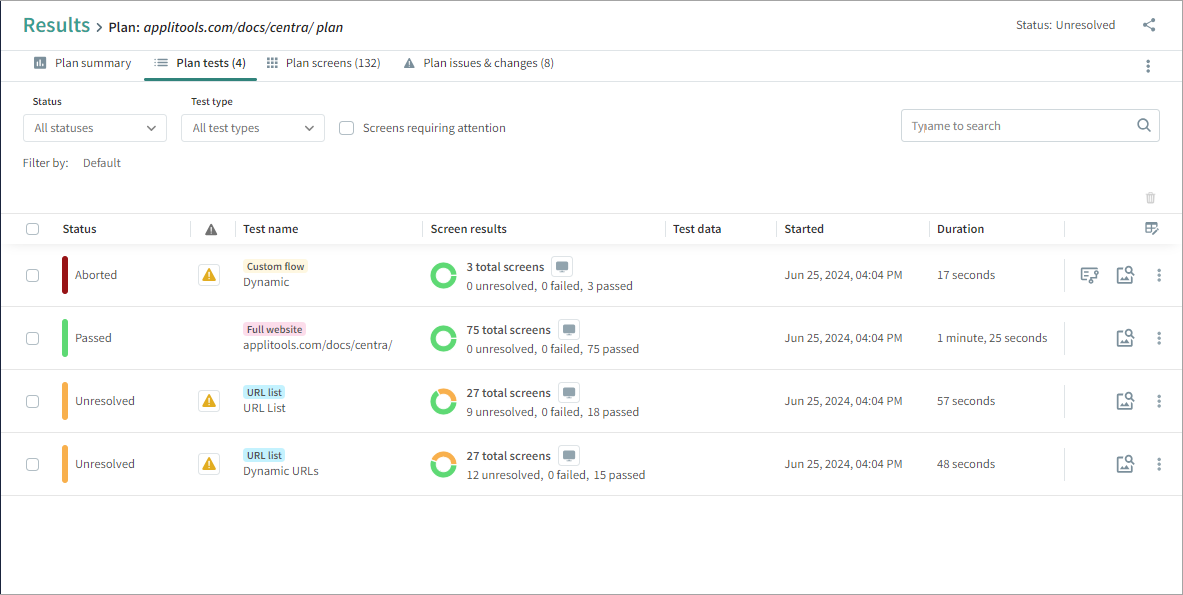
The Tests view in the Results page displays a summary of all tests that ran in a plan, including the status, environments, time started, and duration. start time, and duration. Click on a test to open it in the Test Summary view for that test.

Filtering Displayed Tests
At the top of the Tests view, you can filter the list of tests or search for specific tests.
You can filter by the following attributes:
-
Status – Select one or more test status. For example, you may want to look at all the unresolved or failed tests to identify results that require attention.
-
Test type – Select one or more types (full website, custom flow, or URL list).
On the right side of the filter area is a search box that lets you search by test name.
Test Status
The Status column shows the status of the entire test.
-
 Passed – The test completed successfully and no differences were identified, or differences were marked as Accepted by a user. The most recent passed test is used as the current baseline.
 -
 Unresolved – The test completed successfully and identified differences that need to be reviewed by a user.
 -
 Failed – At least one difference in the test was marked as Failed by a user.
 -
 Running – The test is still in progress. You can view initial data about a test that is still running.
 -
 Aborted – The test did not complete successfully or was stopped by the user. If the test was aborted by the system, check that the Tunnel is configured correctly. For details, see Set Up a Tunnel to Test on Internal Networks If the tunnel is configured correctly, you should look at test details and may need to contact support. For details, see Viewing or Copying Test Details.
 -
 Pending – The test has not started yet.
Viewing Test Flow Results
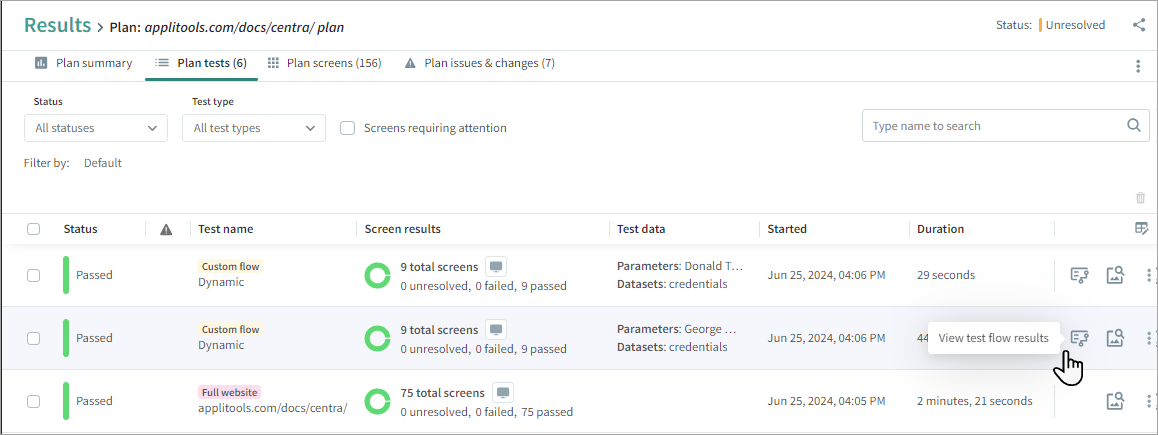
For a custom flow test, you can preview each step in the test, including steps that do not have UI validation.
To View Test Flow Results
-
In the Test View list, next to a custom flow test, click

The system displays all the steps in the test in the Test Flow view.
Opening the Test Analyzer
You can open the Test Analyzer for a test, this allows you to browse through and review all the screens in the test one by one.
To Open the Test Analyzer for a Test
-
In the Test View list, next to a test, click
Viewing Issues
If a icon is displayed next to a test, it indicates that the test encountered issues such as added or removed pages, or pages with errors, such as pages that failed to load.
Click on the icon to view details of the issues in the Issues & Changes view for the test.
Additional Actions
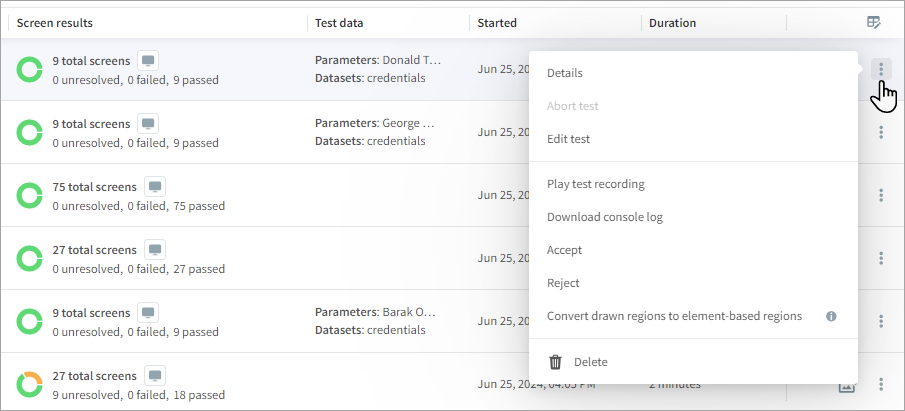
To access additional actions on a test, click

The following actions are available:
-
Details – Displays details of the test, including test name, status, duration, start time, and environments. There is an option to copy details to clipboard, which may be useful if you need to send test details to Customer Support.
-
Abort test – Aborts the test. This option is only available if the test is still running.
-
Edit test – Opens the Edit Test page where you can modify the test for future test runs.
-
Download test recording – Downloads a video of the entire test, which is useful for troubleshooting. This option is only available for custom flow tests.
-
Download console log – Downloads a log file of the test, which may be useful for troubleshooting if the test fails or there is an error.
-
Accept – Marks all diffs in the test as Accepted.
-
Reject – Marks all diffs in the test as Rejected.
-
Convert drawn regions to element-based regions – Converts regions in the test to element-based regions. For details, see Updating Drawn Regions to DOM Elements.
-
Delete – Deletes the selected test run. This option does not remove the test from future plan runs.