The Concurrency Monitoring page
Eyes allows you to run tests concurrently to maximize the amount of testing you can do in the minimum amount of time. The amount of concurrency allowed in your account is defined by your license agreement. An account administrator can choose to allocate proportions of the allowed account concurrency to the teams in the account.
The concurrency monitoring page displays information on the tests in an account that are currently running or waiting to run. This allows any account viewer to see the current concurrency usage relative to the concurrency limit, and to evaluate how the teams in the account are taking advantage of the available concurrency resources.
Accessing the Concurrency Monitoring page
For non-admin users:
-
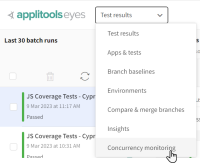
In the Page navigator The Page navigator is a control at the top of the Test manager window that is used to switch between the main pages of the Test manager. It also displays the name of the current page. select Concurrency monitoring.
For admin users:
-
In the Page navigator The Page navigator is a control at the top of the Test manager window that is used to switch between the main pages of the Test manager. It also displays the name of the current page. select Admin and click on the Usage tile.
Concurrency information displayed
Overview
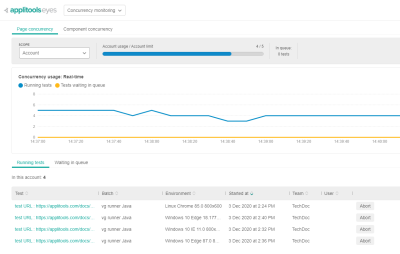
The concurrency information is displayed in three panes:
-
Summary information – The Scope drop-down menu allows you to select to view information across the account, or to limit the display to a subset of the account teams. This pane also shows a bar graph of the current concurrency usage vs the concurrency limit and the number of tests waiting to run.
-
Real time usage graph – The middle pane is a real-time graph that plots the number of concurrent tests and the tests waiting to run over time. The graph is a sliding window that reflects the last five minutes of activity.
-
Test details – The bottom pane shows the names of the tests that are running and tests that are waiting to run, in addition to some other information.
The term running test refers to execution of a test program for a particular execution environment An execution environment is defined as a triplet of <OS, browser, viewport size>. When a test runs, its execution environment is defined by the platform on which the test runs, or, if run on the Ultrafast Grid, by the configuration of the Ultrafast Grid. A baseline is also associated with an execution environment. By default, the baseline chosen for a test is the baseline that has the same application name, test name, and execution environment as the test. Note that if the initial page in a test is not a secure web page, the execution environment may report the wrong OS or browser version.. Each running test corresponds to a test result in the Running state on the Test results page.
The term Test waiting to run, called Waiting in queue in the Test Manager, refers to a test that has been started by the test infrastructure (i.e. the method eyes.open has been called) but the maximum concurrency limit has been reached and the test of an execution environment An execution environment is defined as a triplet of <OS, browser, viewport size>. When a test runs, its execution environment is defined by the platform on which the test runs, or, if run on the Ultrafast Grid, by the configuration of the Ultrafast Grid. A baseline is also associated with an execution environment. By default, the baseline chosen for a test is the baseline that has the same application name, test name, and execution environment as the test. Note that if the initial page in a test is not a secure web page, the execution environment may report the wrong OS or browser version. is waiting for a running test to complete. If your test infrastructure (e.g. TestNG/NUnit/Pytest) runs tests serially, then tests that have not been started are not included.
If your team uses a component based SDK, An SDK whose checkpoints are usally used to test UI components in component galleries such as Storybook. then you will see two tabs. The tab marked Component concurrency displays information from tests run by component based SDK's and the tab marked Page concurrency displays information on page based SDKs An SDK whose checkpoints are usually used to test complete application pages. For example, Selenium, Espresso, XCUI, Cypress and Playwright SDKs..
If have admin privileges, you will also see a Usage overview tab.
Summary information
Use the summary information panel to select the scope of the information shown on the page, and to see the current number of running and waiting tests.

The summary information in the top pane has the following controls and displays:
-
Scope – Select Account to view information across the account, or select one or more Teams to limit the display to a subset of the account teams. You will only see and be able to select teams for which you have at least viewing permission.
-
Account usage/Account limit – Select the Account option in the Scope menu to view a bar chart that updates in real time to indicate the current total account concurrency usage relative to the account limit.
-
Team usage/Account limit – Select one or more teams in the Scope menu to view a bar chart that updates in real time to indicate the current concurrency usage of the selected teams as a proportion of the total limits of the selected teams. The bar turns red if the concurrency limit has been reached.
If the account concurrency limit has not been allocated amongst the teams then the usage is displayed as a proportion of the account limit.
Users with admin rights will see an additional bar chart that shows the current total account concurrency use as a proportion of the account limit.
-
In queue – The number of tests waiting to run.
The pane also indicates the rate at which the display is updated (nominally every 10 seconds).
Real-time graph
The middle pane displays a real-time graph of the number of tests running and the number of tests waiting to run in the last five minutes.
The number of running and waiting tests displayed depends on the selected Scope. If you select Account, then the numbers refer to the tests in the account that you have permission to view. If you select one or more teams, then the numbers plotted on the graph include only tests from the selected teams.
The X axis shows the time of day. When you first switch to this page, the graph will start updating from the current point in time. The graph then fills up, and when the entire graph width has been filled, the graph will slide to the left so that you always see the most up-to-date concurrency information.
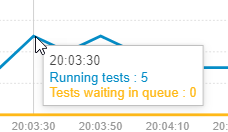
Position your cursor at any point on the graph to see the time (X) and the running and waiting tests (Y) at that point.

Running and waiting test details
The pane at the bottom allows you to see the details of the tests that are running and waiting to run. The set of tests displayed depends on the Scope control. If you select Account, then the table includes the tests in the account that you have permission to view. If you select one or more teams, then the table only shows tests from the selected teams.
The table has the following tabs:
-
Running tests – Shows information about the tests that are currently running based on the selected Scope and the teams for which the user has viewing permission. The information displayed includes the Test and User name, Batch name, execution Environment, name of the Team, and the time the test Started at.
-
Waiting in queue – Shows information about the tests that are waiting to start running based on the selected Scope and the teams for which the user has viewing permission. It shows the same information as the Running test except that it shows the amount of time the test has been Waiting in the queue as opposed to when it started to run.
Above the table, a field indicates the number of tests running or waiting depending on which tab you are viewing and what the chosen Scope. The In this account field displays how many running/waiting tests there are currently across the account. If you limit the scope to a subset of teams, then the In scope field is displayed instead, and indicates the number of running/waiting tests from the selected teams.
Aborting tests
Both the Running and Waiting tables have an Abort button next to each test. Clicking the button will abort the running of that test. Aborting tests is also possible from the Test results page. By default the button is at the far right. In the screen-shot shows it has been moved it to the right of the test column (see below Reorganizing the table).
Searching for tests
Above the table on the far right, a search field allows you to enter text. The table is filtered to shown only tests whose name includes the typed text.
Reorganizing the table
As for most tables in the Test Manager, you can use the button to select which table columns to view and their order.


