Batch summary view
The Test results page provides multiple views that allow you to view the test results in different ways. Use the toolbar View selector to select a particular view.
This section describes the Batch summary view  .
.
The Batch summary view displays information about the batch currently selected from the list in the left pane. The charts in this view display information and statistics based on the current status information.

Viewing Batch summary status information
Chart functionality and behavior
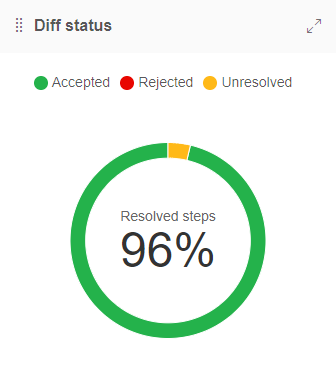
Color-codingEach chart is color-coded and is accompanied by a legend. In the example below, the Diff status chart shows Accepted and Unresolved segments of the chart using green and yellow respectively.
Sometimes, the legend associated with a chart indicates that there are more possible states than those displayed in the chart. The legend in the Diff Status chart also, refers to Rejected statuses that are color-coded red. However, the chart below does not show information for Rejected Diffs, indicating that the data sample did not contain Diffs that were rejected.
Hovering the mouse pointer over a chart segment displays extra information about the data or the status of that segment of the chart. In the example below, hovering the mouse pointer over the yellow segment in the Checkpoints chart shows the number of mismatching checkpoints.
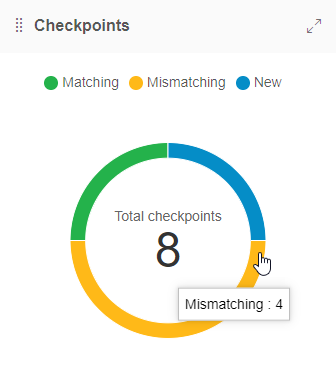
Chart descriptions
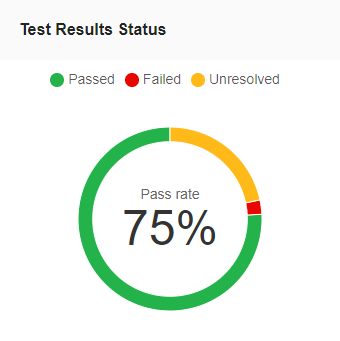
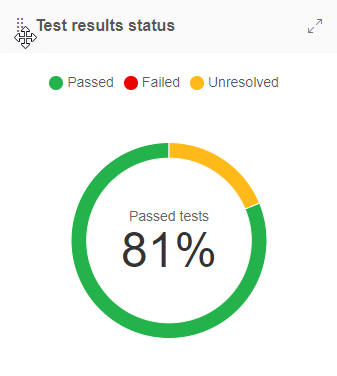
Test results status
The Test results status is a Radial chart that displays the pass rate for all the tests executed as part of the batch. The pass rate represents the ratio of tests that passed compared to the tests that did not pass, expressed as a percentage.
Diff status
A Radial chart that displays the percentage of Diffs that are currently Accepted, Rejected or Unresolved for the selected batch.
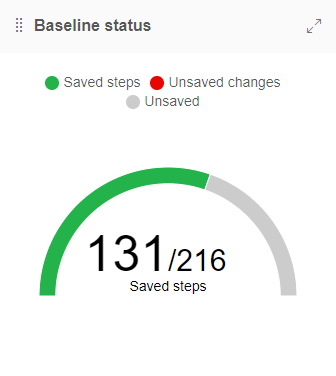
Baseline status
The Baseline status chart gives you an overview of your work progress on the batch. It shows the number of steps changed and saved compared to the total number of steps in the batch. A change refers to you accepting or rejecting a step, or adding a region, remark, or issue to it.
- Saved steps refers to steps that were changed in some way and subsequently saved to the baseline.
- Unsaved changes refers to steps that have been changed in some way but have not yet been saved to the baseline.
- Unsaved refers to steps that have not been changed in anyway since the batch ran.
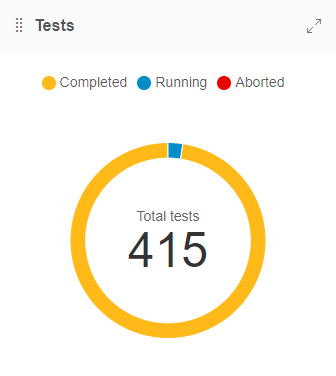
Tests
A Radial chart that indicates the total number of tests in the batch and the number of those tests that are Completed, Running or Aborted.
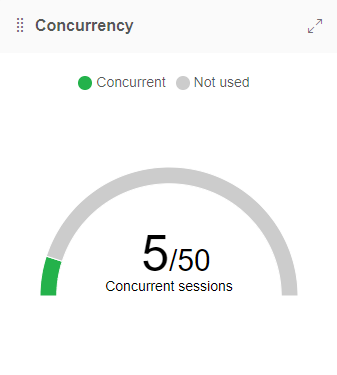
Concurrency
A Radial chart that indicates the number of tests that ran in parallel in the batch out of the maximum number of tests that are allowed to run in parallel for the account.
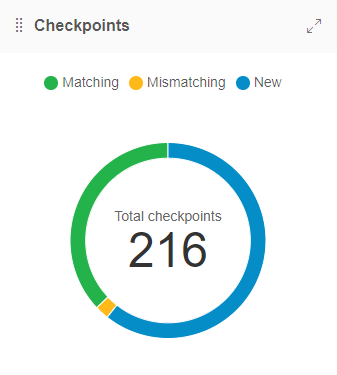
Checkpoints
- Matching refers to checkpoints for which Eyes did not detect any differences.
- Mismatching refers to checkpoints that Eyes recognized as missing or checkpoints that were identified as having differences.
- New refers to checkpoints for which no corresponding baseline image was found.
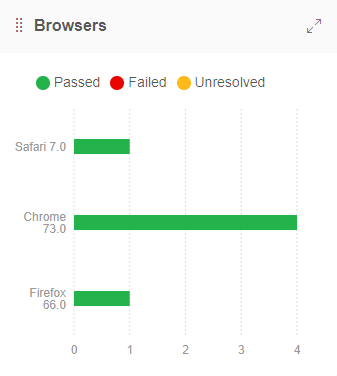
Browsers
A Bar chart that shows the test result status across browsers on which tests were executed as part of the batch.
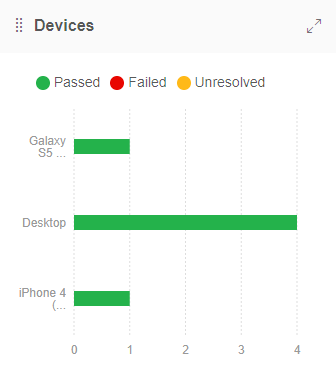
Devices
A Bar chart that shows the test results status in the batch as distributed across emulated devices and desktop browsers.
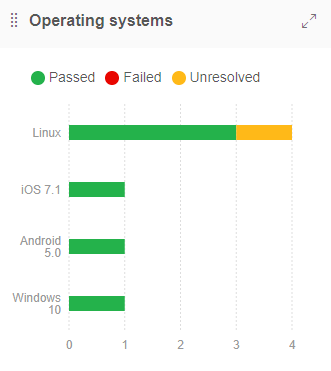
Operating systems
A Bar chart that shows the test result status across Operating systems on which tests were executed as part of the batch.
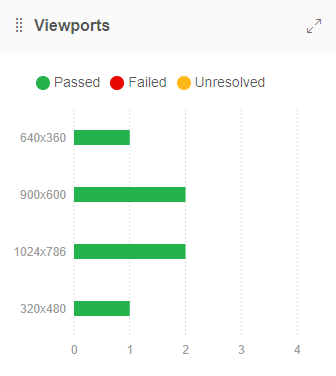
Viewports
A Bar chart that shows the test result status across the Viewport sizes on which tests were executed as part of the batch.
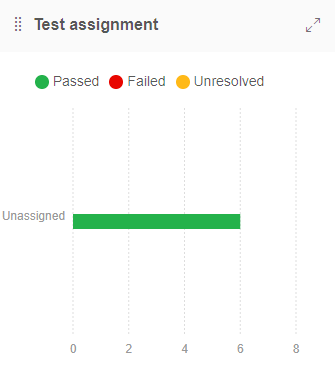
Test assignment
A bar chart that indicates the test result status of tests that were assigned to each team member. Tests that were not assigned to any team member are represented by a bar that is labeled as Unassigned.
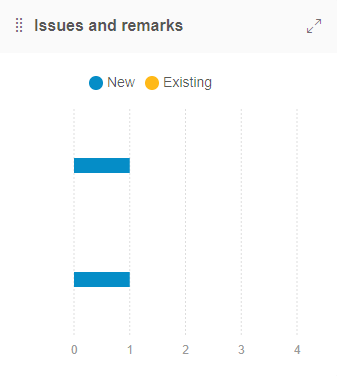
Issues and remarks
A Bar chart that shows two bars, one for Issues and one for Remarks, that indicate the number of Issue and Remark regions applied in steps checked as part of the batch. The Issues and Remarks bars are color-coded to show the number of Issues or Remarks that are New or that were already Existing. New issues and remarks are those which were created in the current batch. Existing issues and remarks are those which were created in a previous batch.
Arranging the charts in the Batch summary view
You can reposition charts in the Batch Summary view by dragging and dropping them into new positions. You can also expand the chart size to zoom in on detailed information.
Repositioning charts
You can rearrange the default position of charts in the Batch summary view. For instance, you can position charts that you refer to frequently at the top of the view.
- Hover the mouse pointer over the symbol in the chart title bar and the mouse pointer changes to a Drag icon.
- Drag and drop the chart into a new position.
Expanding the chart size
You can expand the size of the status information charts in the Batch Summary view. Expanding the chart size opens the chart as a pop-up window that overlays the main view.
- Click the Expand symbol in the chart title bar to expand the chart and open in a pop-up window.
- To close the pop-up window, click the X symbol in the chart title bar.
