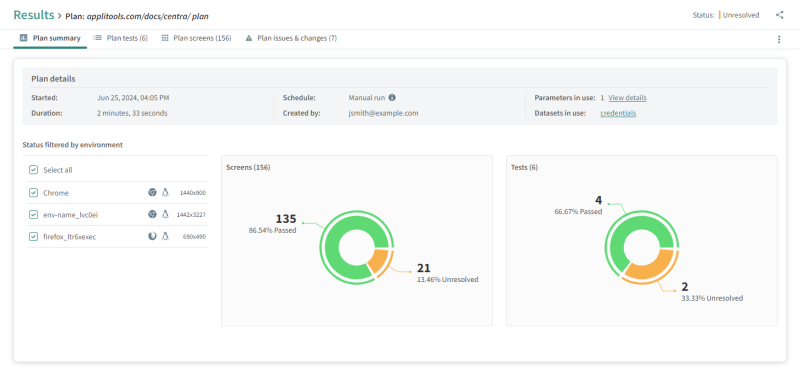
Summary View
The Summary View includes results with screens and test status charts, as well as general details on the plan and the test.
You can open this view for an entire plan or for a single test within a plan.
To Open the Plan Summary View
-
In the , select Results and in the list of results, click on a plan.
To Open the Test Summary View
-
In the , select Results, click on a plan and in the Plan test view, click on a test.
Details Area
The top part of the Summary view displays information about the plan or test, including the following:
-
Start time and duration
-
User who created the plan or test
-
Parameters and datasets used in the tests. If parameters or datasets are used, you can click on the name to view details.
For a plan, the Details area also displays the plan schedule.
For a full website test or URL list test, the Test Results Highlights area includes the following information:
-
Unique URLs that were tested
-
Browsers & devices
-
Total captured screens - (the number of unique URLS multiplied by the number of browsers & devices)
For a custom flow test, the Test Results Highlights area includes the following information:
-
Total steps in test
-
User action steps
-
Total captured screens - (the number of unique URLs multiplied by the Browsers & devices in the test)
Summary area
The summary area includes a pie chart with a breakdown of the status of all screens. For a plan, the chart includes data from all tests in the plan and a separate chart shows the status of each test in the plan.
You can filter the chart by Browsers & devices.
Click on a segment on the chart to view a filtered list of screens or tests.

