In our State of Automated Visual Testing report, we share our research and insights about the cost of visual bugs found in production in companies like yours. Based on the number of builds you release a month, and the total number of unique screens on which your application runs, we can help you estimate the number of visual issues you might expect to find — and their cost to you.
Now, we can help you get real data on your own development processes. Applitools Eyes 10.7 introduces a new set of built-in metrics, called Insights. The new Insights feature provides you with a visual display showing your current test status, including passing tests out of all tests run, failing tests, as well as new results to inspect and evaluate. You can view your overall results, as well as filter your results by batch run or by a named team – as well as report results over a specific date range. With Applitools Eyes Insights, you can track the progress of your visual testing projects.
Engineers measure, because we quantify everything. We want to know how much faster we can complete process A compared with process B. Or, we might want to know the resource requirements to complete a given task. Other times, we want to know the quality of our processes. We are measuring constantly.
When you subscribe to Applitools Eyes, you do so with an implicit assumption that visual testing with Applitools makes your team more productive. You expect to run more tests more easily. And, you expect to uncover a greater number of visual regressions that require a fix. Like most of our customers, you get a sense that your code behaves much better. And, like most of our customers, you want a way to quantify the improvement.
Introducing Applitools Insights
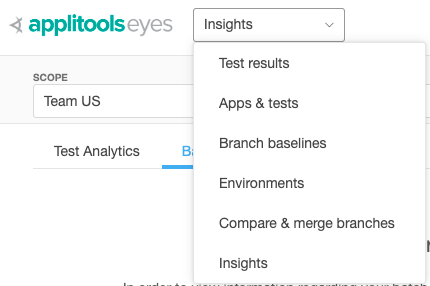
Applitools Insights reports on the tests you run with Applitools. You access Insights from the Applitools Test Manager page – part of the set of reports that show your results from your test runs.
The Insights page provides you with a number of charts that give you visual testing insights related to the performance and effectiveness of tests that teams execute on your account. Reviewing the charts allows managers to identify ongoing trends or risks. The scope of data that you can view is role based. Account admins can view data at the account and team level. Users that do not have admin rights can only view data that relates to the teams for which they are a member.
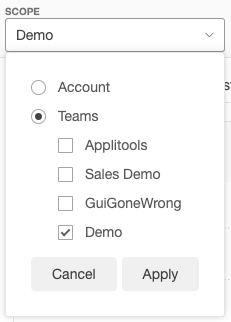
You generate the charts by specifying the value for two settings, the Scope, and the Date Range. The Scope determines if data is taken with respect to the entire account or one or more teams that are assigned to your account.
To set the scope, select your scope from the “SCOPE” pull-down. Your choice for scope can be your entire company, or a specific team or teams you identified previously that you select.
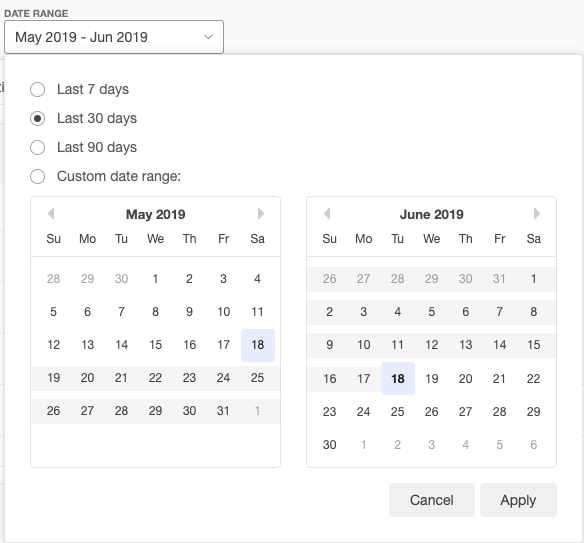
The Date Range sets the time frame boundaries for which the Insights data is collected. You set the date either in a preset of the past 7, 30 or 90 days, or a custom range you specify in the date selector.
The Insights page layout
The Insights page is divided into several sections:
- Insights toolbar.
- Tests Analytics tab.
- Batch Statistics tab.
- Tab toolbar.
The Insights toolbar
From the Insights toolbar, use the Scope selector to select the account or teams for which you display visual testing insights. Next, use the Date Range feature to set the time frame used for extracting information from the database.
The Test Analytics tab
This tab displays a set of charts that provide at-a-glance insights into all your executed visual tests. The statistics reflect the scope and timeframe you set in the Insights toolbar.
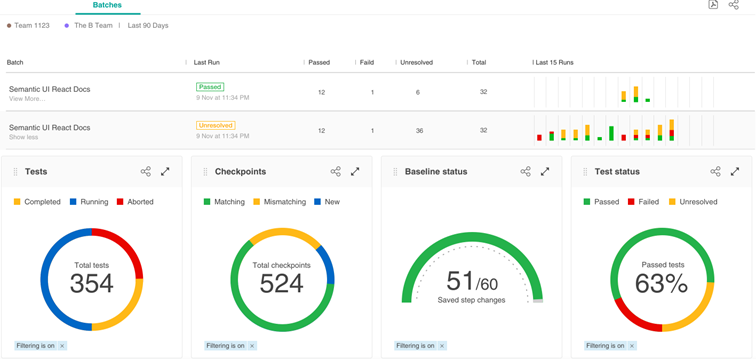
The Batch Statistics tab
Displays a list of Batches that were executed over the selected time frame. Each row in the list displays a separate batch and basic batch run and status information such as Last run, Pass, Fail, Unresolved and Total runs. Clicking a row expands the row to display a set of charts and analytics for that Batch.
The Tab toolbar
Provides various tools for arranging the display or extracting and sharing information presented on the tab. The available toolset varies depending on which tab is active.
Other Tab toolbar controls include:
- Arrange display: when you click the Arrange display icon, the page changes to allow you to reposition the charts. Drag and Drop the charts into a new position and then click the Arrange display icon again to return to the regular display.
- Print PDF: to create a PDF of the current report, click the PDF icon to capture the screen, ready to save in PDF format.
- Share link: To share the current report with someone, click the Share link icon to copy a link for the current page to the clipboard. From that point, you can share the link.
Looking at Test Analytics
The Test Analytics section includes five basic reports:
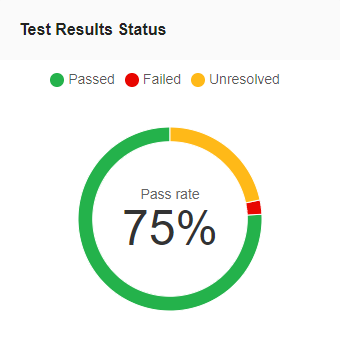
- Overall test results status – pie chart showing Passed, Failed, and Unresolved for scope and date range.
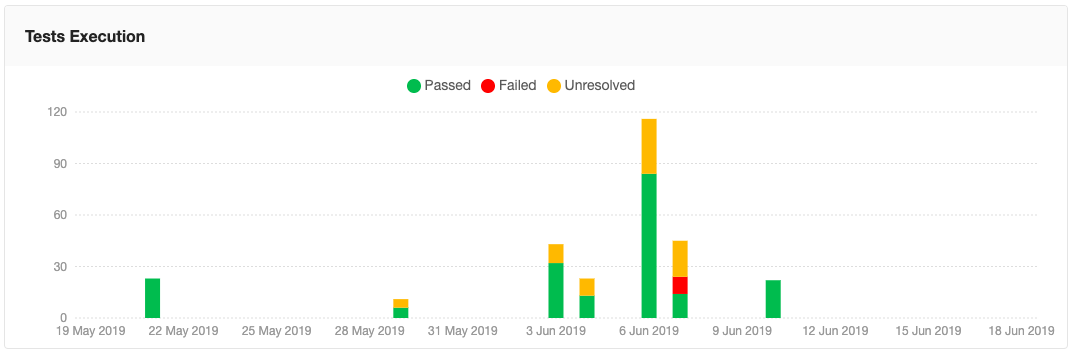
- Results of test execution – This report takes the form of a vertical bar chart. When you open it, you see bars showing the number of tests and horizontally broken up by time. Test Execution shows overall tests run over the entire date range. You can find Passed, Failed, and Unresolved and shown in bars broken up in time. If instead, you choose Test Execution by Team, you see tests run in total by a given team or teams over time. The Test Execution by Team gives you visual testing insights for a team or set of teams over time.
- Defined tests over time – a line chart for a selected scope of teams showing the number of defined tests run over each period. A separate line is shown for each team
- Detected issues over time – a line chart for a selected scope of teams showing the number of issues discovered over time, broken down by team
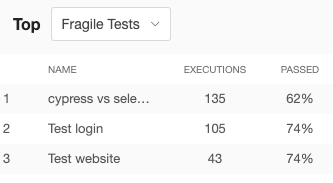
- Number of executed tests by – horizontal bar chart, broken up vertically by parameters. This report gives you insights into your visual testing, organized by an individual, by team, or by target test platform. For a given scope and date range, the number of tests across a selected set of test parameters. Parameters include Assignee, Browser, Device, OS, and Viewport. Within these, appropriate parameters segregate (e.g by a named browser). You can also view your most and least stable apps and tests. This way, you know which tests to focus on maintaining, and which apps to focus on testing. Here’s a chart of our least stable tests, for instance:
Looking at Batch Statistics
If batch runs interest you, we thought of you in our design. Applitools Eyes Insights uses the Batch sequence name to group batch data automatically. Insights collects, analyzes, and presents batch and test execution status information. You see just the visual testing insights for the batch tests meeting your scope and date range criteria.
Each Batch sequence is presented in its own row in the Batch sequence list. Within that row, you can see all the data for that batch sequence, including status, run time, and most recent result. For your selected scope and date range, the report shows you insights into all your visual testing runs. You collect insights into the visual testing for the batch, including the number of passed, failed and unresolved images, as well as total runs.
Clicking a row expands the row to show a set of charts and analytics that provide further visual testing insights and statistics on the batch sequence.
Next Steps
- Read our blog post explaining why screenshot image comparison tools fail with dynamic visual content.
- Read our blog post about another new Applitools Eyes 10.7 feature: How to integrate BitBucket into your Visual Testing
- Read Dave Haeffner’s Series on CICD Automation
- More from Applitools: Request a Demo, Sign Up for a Free Account, or visit our Tutorials.